Market view May 23, 2022 (Second post today)
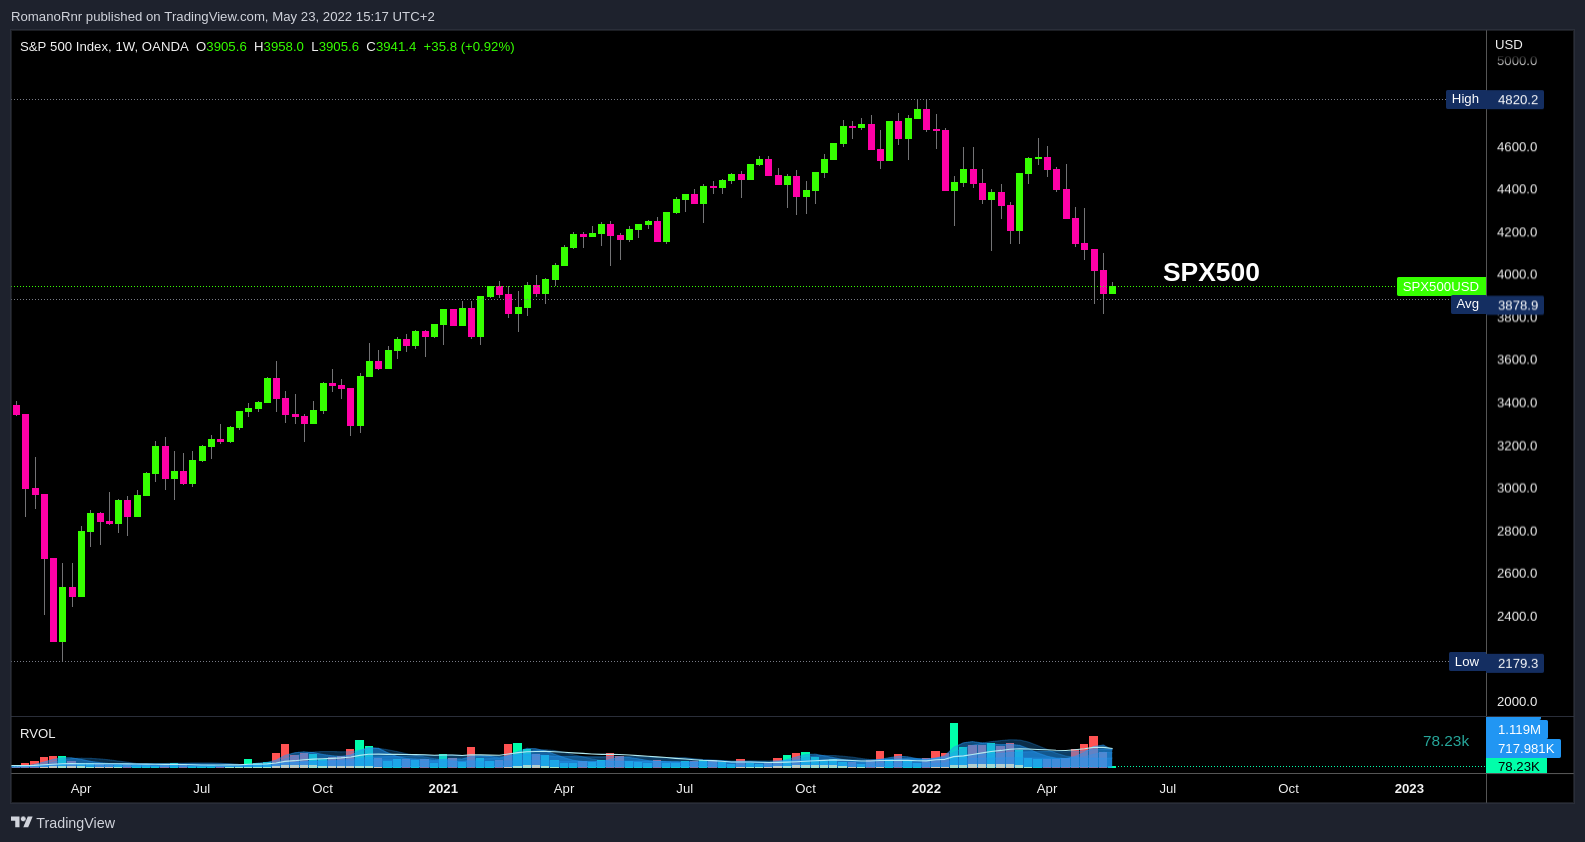
The SPX500 is currently trading at $3878
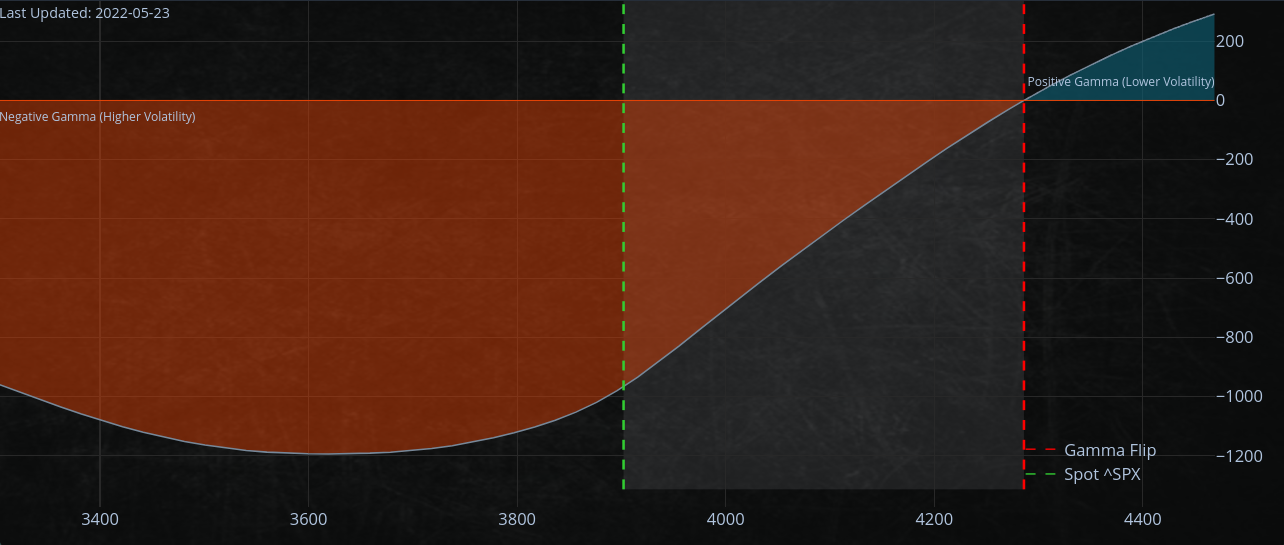
On Friday, May 20 after OPEX, a lot of options expired. Additionally, there was a sharp move higher into the close on Friday. That was possibly an opportunity for short-covering for some market participants.
This Gamma curve (a measure of the change in the options market's delta) flattens out around $3600 - $3700 on the SPX500.
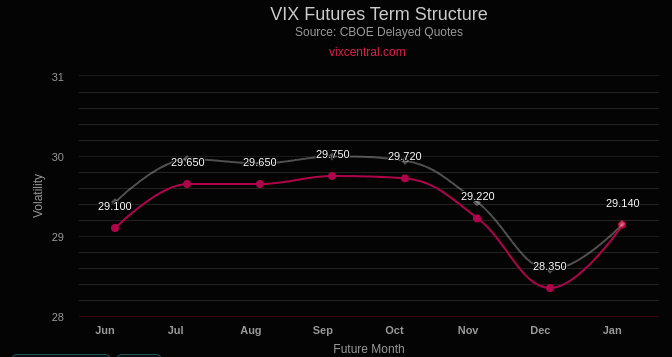
VIX
The VIX is trading at 29.42. We can use the rule of 16 to know what moves the market is pricing today.
29.42 / 16 = 1.84%
Today, the market is pricing in a 1.84% daily move in the SPX500.
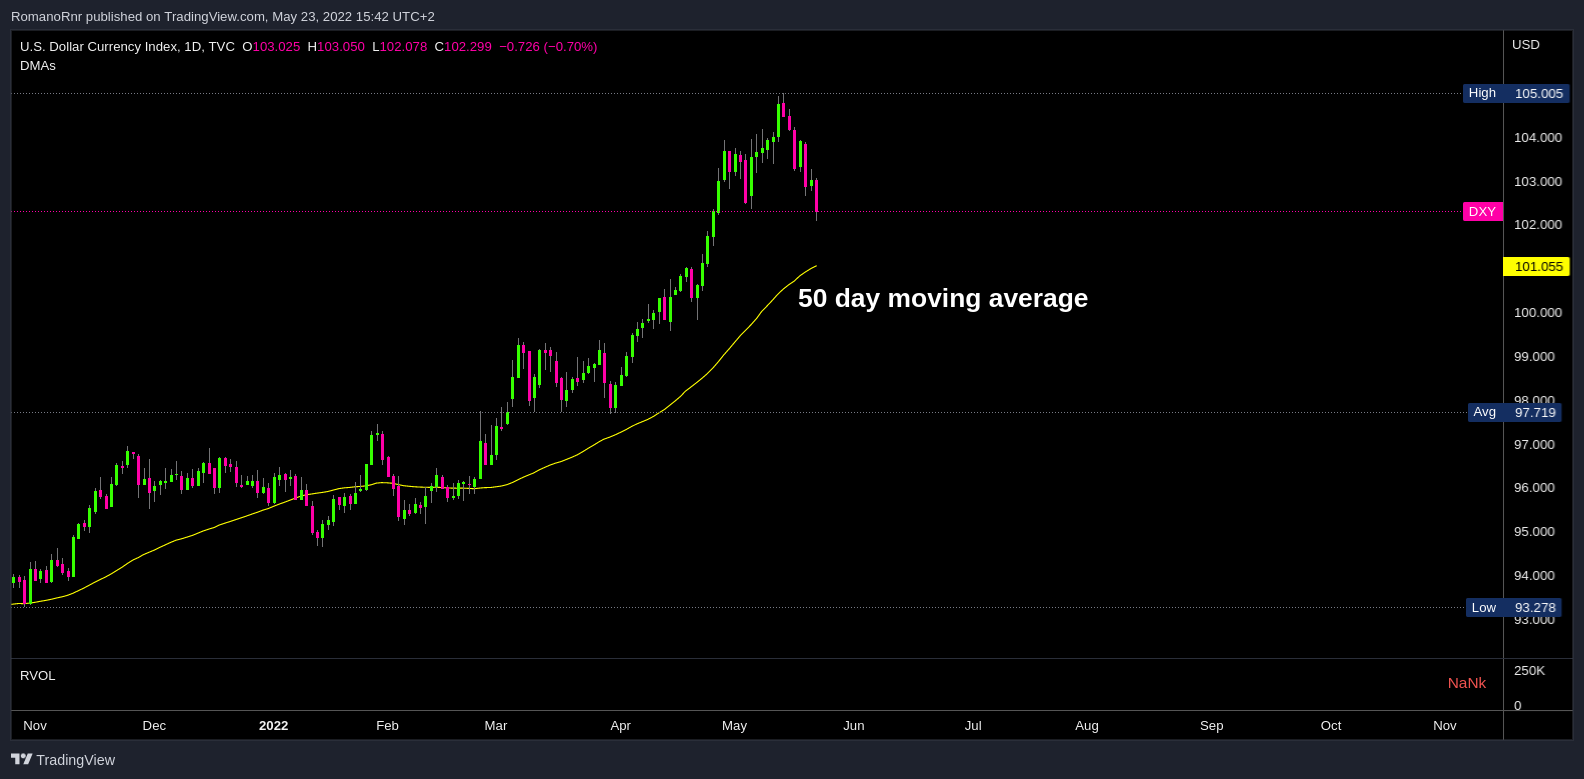
DXY (Dollar)
The dollar is currently falling and is trading at some of the lowest levels since early May.
If the trend continues, the dollar will likely continue to fall, with potentially no real support until the 50-day moving average around $101.
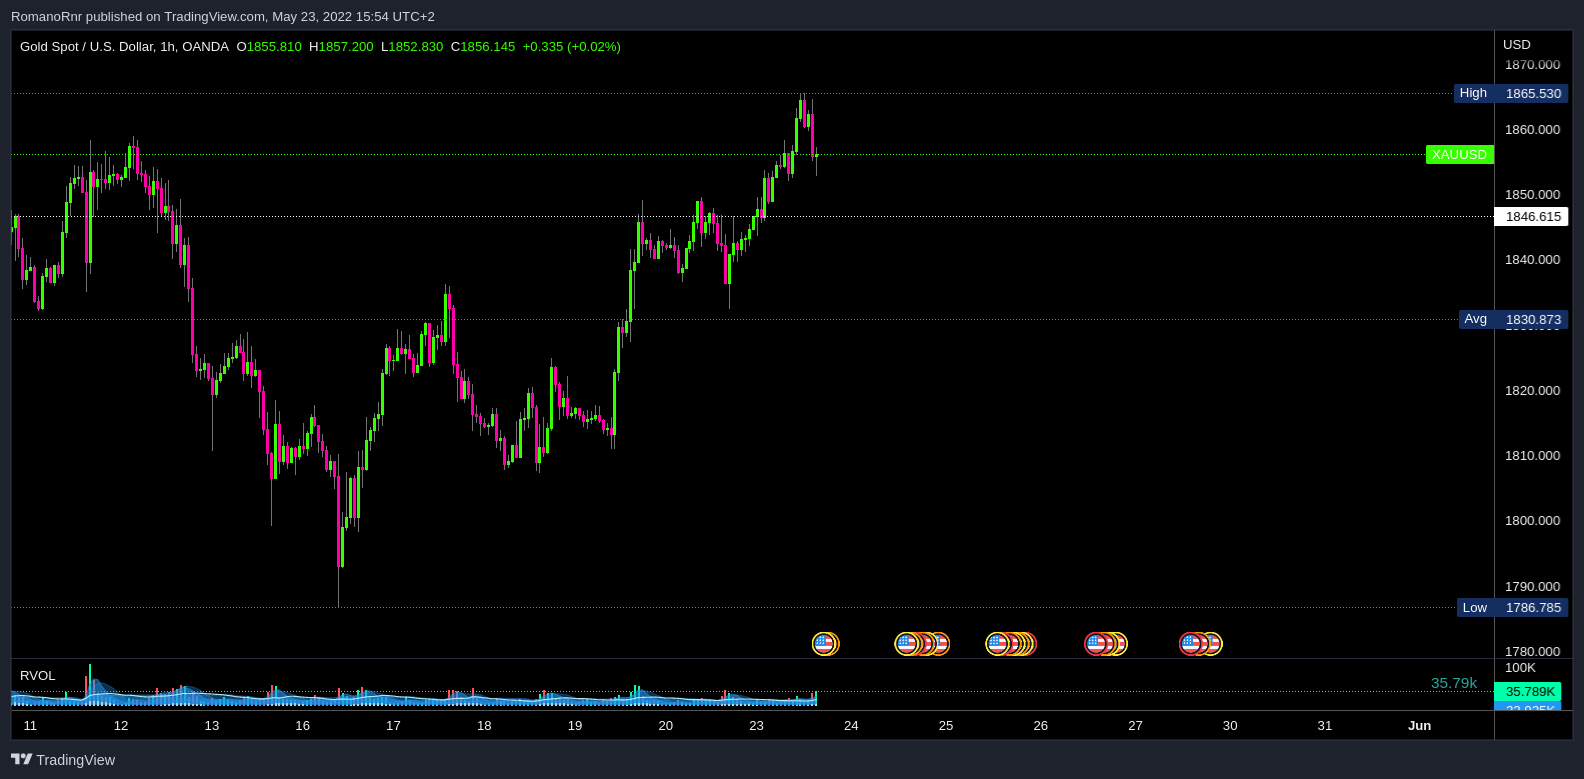
Gold
Since the dollar has been moving down, Gold has been moving up again.
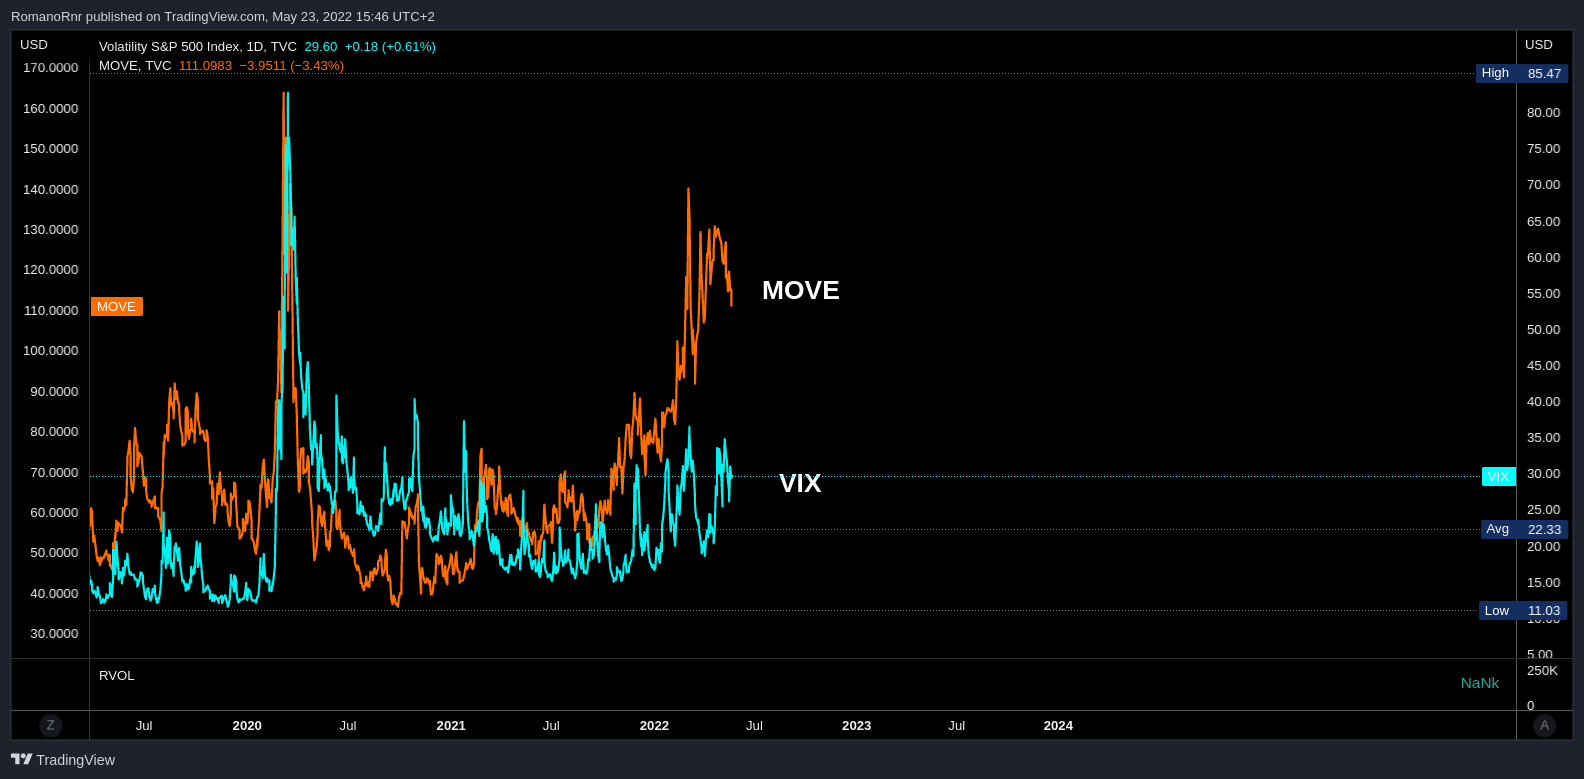
Credit markets
The MOVE index is a measure of bond market volatility, and it spiked recently to levels not seen in years.
The stressed credit markets were a sign of incoming panic in the stock market couple of weeks ago.
However, the MOVE has recently declined again. That could be a sign that the bond market is stabilizing.
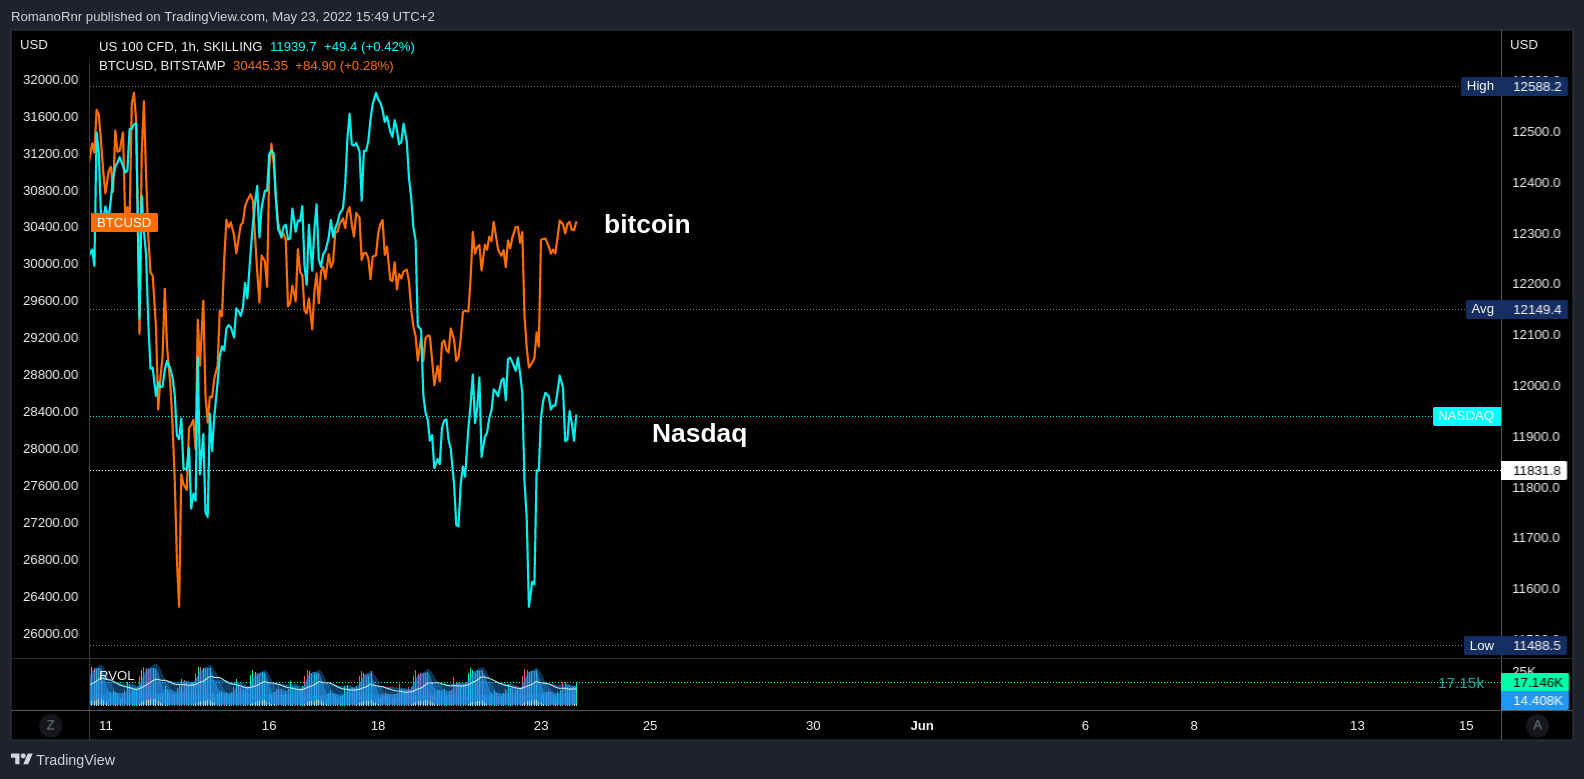
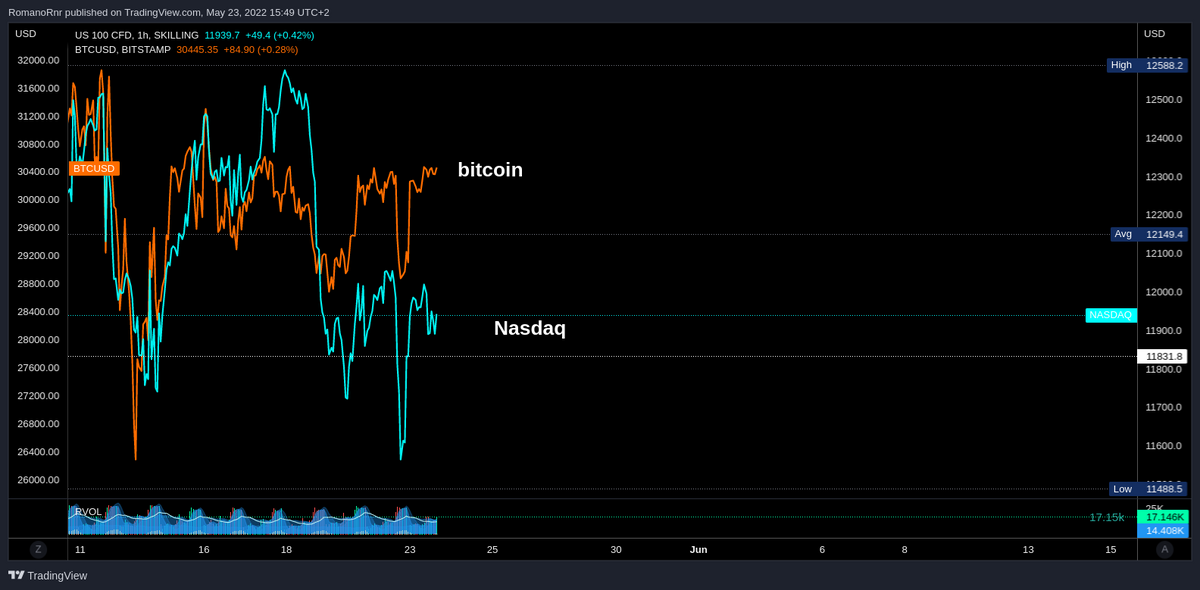
Correlation BTC & Nasdaq
The correlation between NASDAQ and BTC continues to be strong, with NASDAQ catching up to BTC's recent gains. That may indicate that BTC shows more room for equities to squeeze in the short term.