Strategize: Prepare For A Last Rate Hike & Market Crash - part 3

Since 2022, the chief investment strategist at BofA has held a bearish outlook on US equities. He accurately predicted that the Federal Reserve would aggressively increase interest rates, causing the market to experience a decline in 20222.
He stood out from all the mediocre fund managers such as Cathie Wood, salesmen such as Chamath Palihapitiya, and crypto venture capitalist charlatans with their constant quackery about "UpOnly".
Chief investment strategist at BofA warned that the Federal Reserve would tighten until something breaks, and the SPX500 would fall to around ~$3800 by March 8. After his long-winning steak, he was right about his price target, just a few days off. I still give the man the credit.
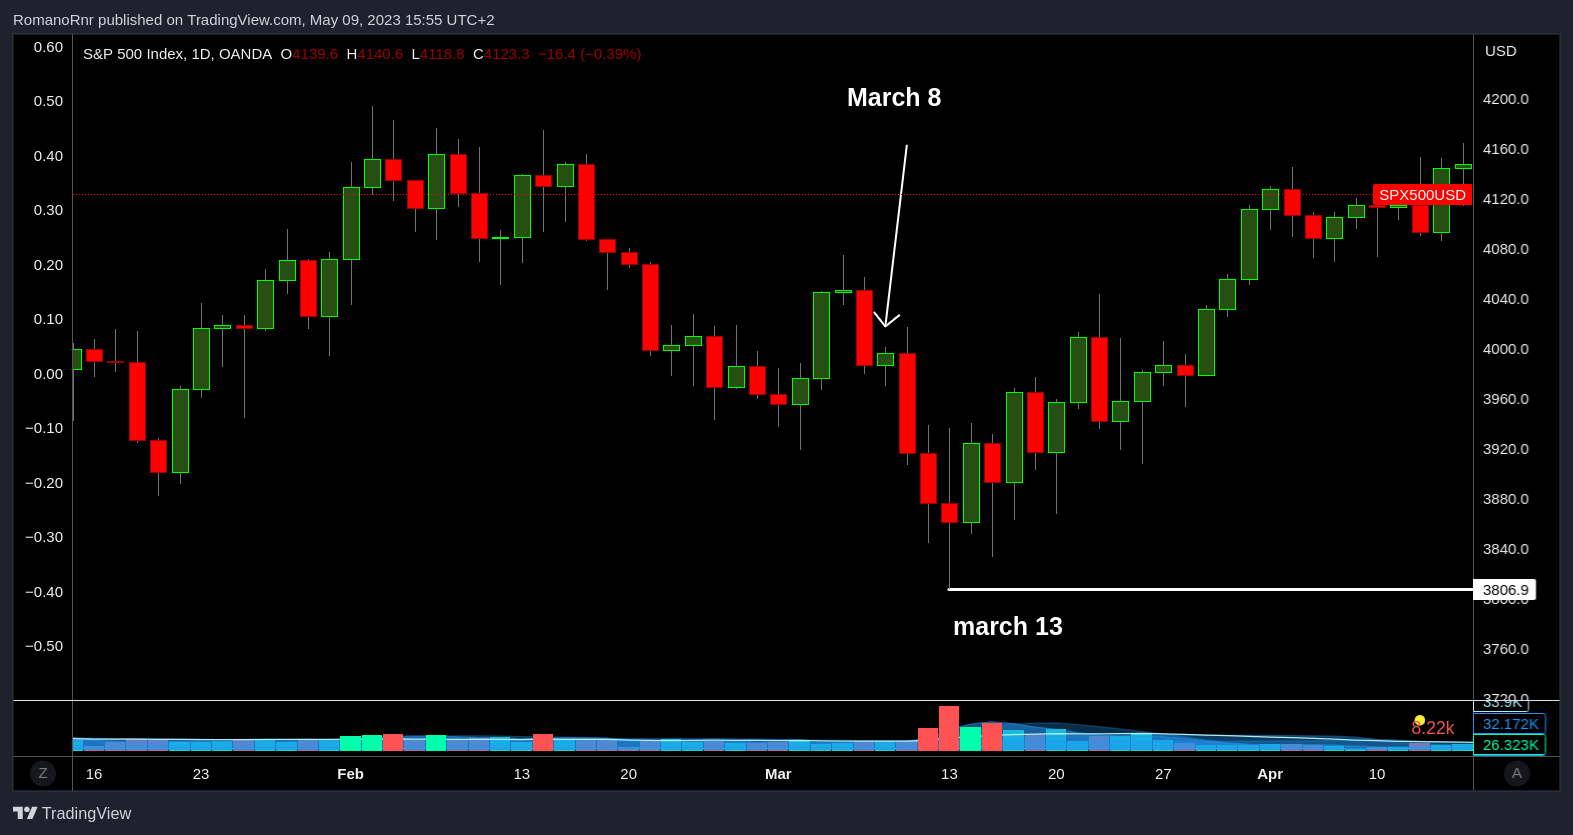
Michael Hartnett is the chief investment strategist at Bank of America Corp. He has been bearish on US stocks since 2022, predicting that the Fed's rate hikes would lead to a recession and a market crash. He also warned that the Fed would tighten until something breaks and that stocks would swoon to 3,800 by March 8, 2023.
Note: If you're a premium subscriber, you can use the play button to listen to the article instead of reading
We covered his other analysis in the previous articles, which you can find here.
Part 1:

Part 2:

My previous article covered that the latest rate hike of 25 basis points on May 3 might have been the last hike before a pause.
That article you can find here:

You can probably connect the dots by now. As the first title suggests: "Prepare for a last rate hike & market crash"
Part 2, published on April 12
BofA advice: Trade the near-term bounce, but be ready to "sell the last hike." That will set the stage for a 3-6-month-long market crash. To benefit from this, look at yield curve steepeners, shorting the US dollar, and go long on gold. Sell S&P 500 (SPX) at rallies ~4100-4200, as bearish sentiment plus policy panic will drive regional banks to collapse.
Shorting the US dollar & longing Gold should be marked as outdated advice since the dollar went down & gold already rallied.
The time has come to fade any rallies on the SPX500. Now you may wonder why a pause in hiking interest rates is not bullish in this scenario.
Discord invite
Are you already a premium member? Here's the invite link and instructions to join Discord

Investment Strategies for a Hard Landing Following Rate Hikes
According to the chief investment strategist at BofA, simply pausing rate hikes is not a sufficient reason to invest in stocks. The strategist predicts that credit events leading to a "hard landing" will negatively impact the resilience of the credit, technology, and homebuilder sectors.
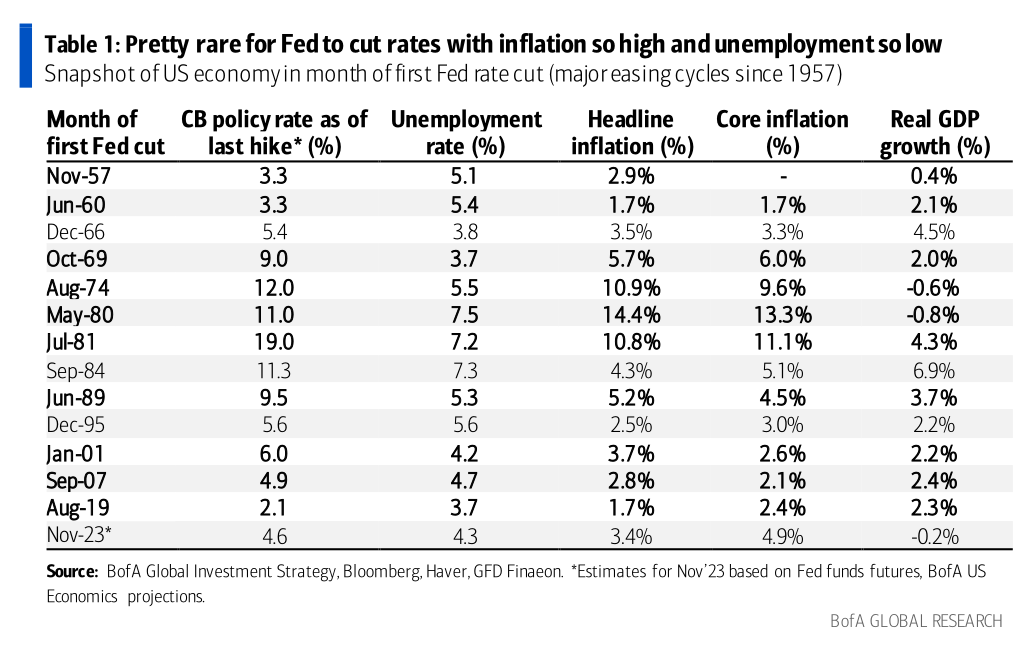
A new structural bull market requires the Federal Reserve to start "easing, " which would need a big recession. Not "recession vibes", "vibe session", or "feelings" but for the recession bell to ring.
His advice is to sell the last rate hike.
I argued that the most recent hike rate on May 3 would be the final one.
The chief investment strategist at BofA suggests keeping an eye out for investment opportunities in assets like oil, small caps, and banks (ironically) in the event of a hard landing.
To fully understand the investment strategies for a hard landing, read my previous articles first.
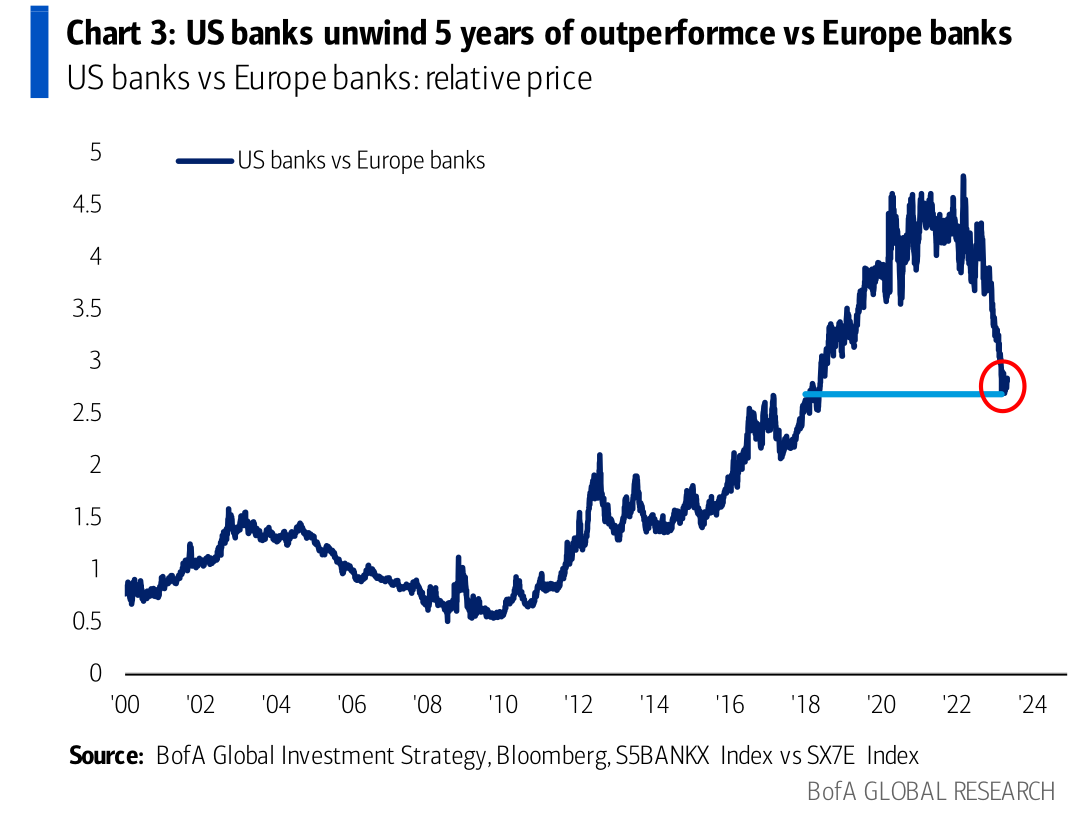
US and European Banks
The surge in US Treasury yields triggered a sharp reversal in the relative performance between US and European banks. US banks outperformed European banks for the past couple of years thanks to their stronger economic recovery, higher interest margin, etc.
However, the Federal Reserve's decision to start tapering bond purchases and their aggressive pace of rate hiking raised concerns about the impact of higher borrowing costs on the US economy and banking sector.
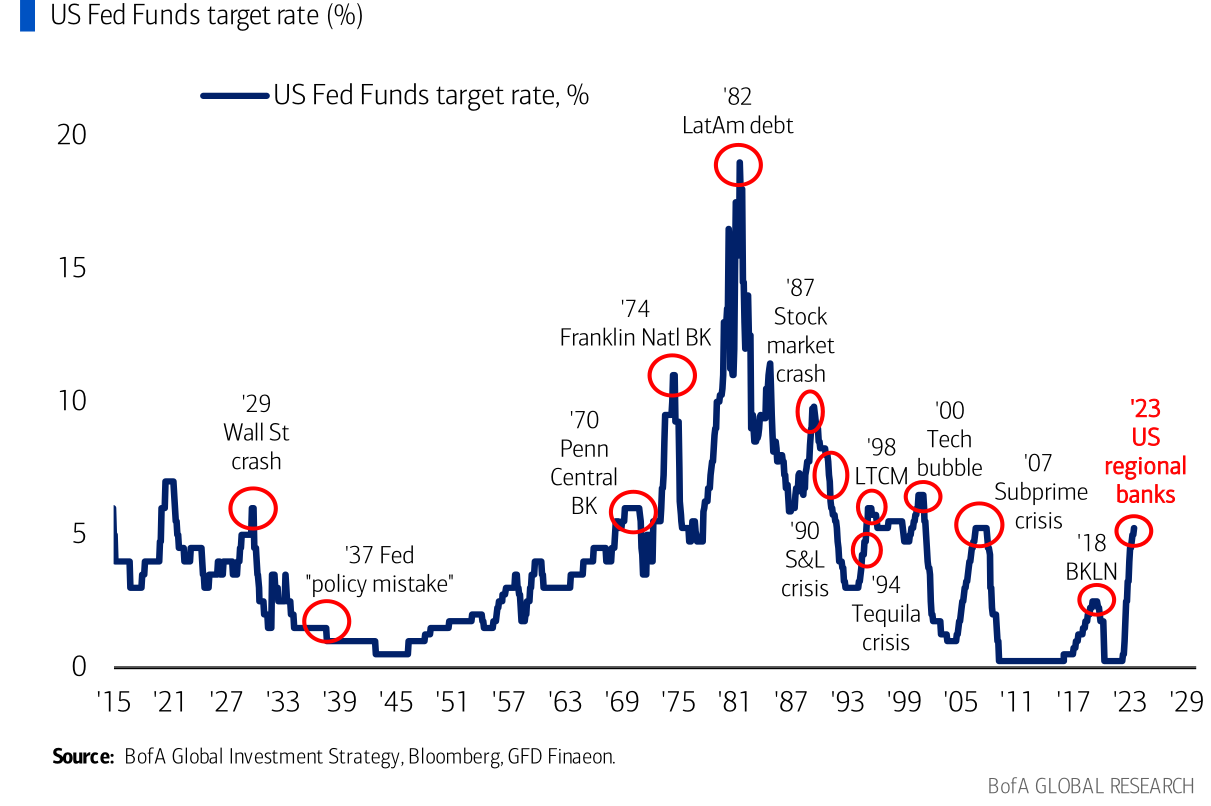
Fed hiking cycles always 'break' something.
This time things started to break within the US regional banking system. The Federal Reserve's monetary tightening can expose more vulnerabilities in the US banking system, such as excessive leverage, credit risk, and liquidity issues.
If I am correct, most European banks didn't suffer that much as they benefited from the slightly less ECB hawkish stance, which has kept bond yields and funding costs lower. As a result, European banks regained some lost ground against US banks in the past week.
US Debt Ceiling Reaches Unprecedented Levels
The US debt ceiling reached an all-time high of $31.4 trillion. That's the collective GDP of major superpowers, including Germany, Japan, the UK, France, India, Canada, Brazil, Australia, Mexica & Korea combined.
More about GDP:

That's pretty concerning and largely the result of the Federal Reserve's policy of “monetizing” the debt (by the money printer) since 2009.
The US dollar entered its 4th bear market in the past 50 years. BofA strategist Michael argues that this time, it may not recover as quickly as it did in the past. The continuous printing of money has resulted in a rise in debt and inflation, which does not bode well for the future of the US dollar. The situation worsens due to fiscal excess and inflation, possibly leading to default and de-rating of US assets.
If you aren't up to date about the debt ceiling issue, read my previous newsletters, which I didn't post that long ago
https://www.romanornr.io/the-us-debt-ceiling-usdjpy-opportunity-24-04-2023/
https://romanornr.io/the-us-debt-ceiling-debate-continues-part-2-27-04-2023/
Before continuing reading
Do you feel like you're missing out due to only being able to trade crypto? Perhaps it's time to create a real broker account & join the big boys
I use Interactive Brokers: https://ibkr.com/referral/romano169 On Interactive Brokers you are able to buy fractional shares
Feel free to sign up with other brokers & join us on Discord if you're a premium member. The community members and I can help you with the registration process, questions, etc. You won't have to be alone
US Technology Stocks Compared to S&P 500 Index
US tech stocks outpaced the S&P500 for years, reaching new speaking recently. However, this strength may be deceiving.
A trip back down memory lane. Remember, in early 2022, I mentioned that rotations might take place from tech stocks to energy. Anticipating a rally in energy. I'm not going to lie here, and I didn't expect a war between Russia & Ukraine. There are some cases when I wish I had it all wrong. All political bullshit and edgy take aside, many lives have been lost.
The mean reversion of mean reversions!!!
— Romano (@RNR_0) January 28, 2022
The rotations of rotations?
Tech -> SPX500 --> Energy pic.twitter.com/vR3Q7SpAYq
Anyways to continue on. Here's a rotation meme.
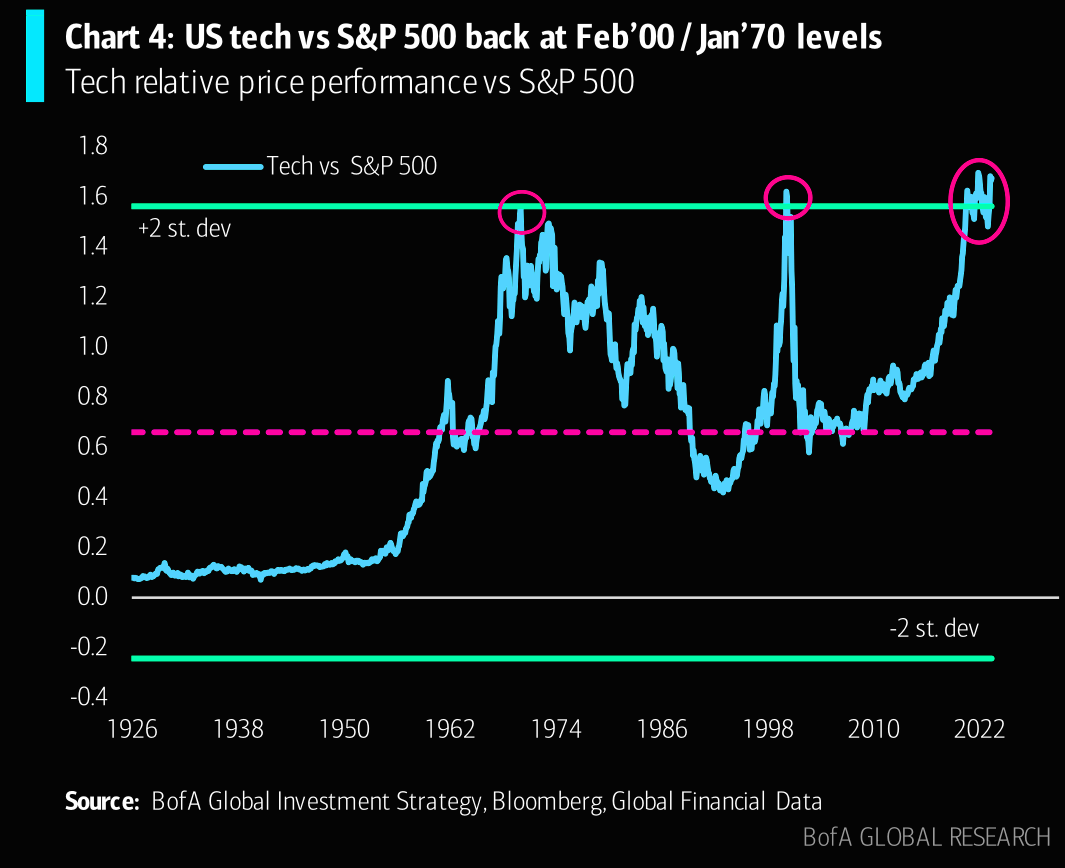
As mentioned before, the apparent strength of US tech stocks might be deceiving here. However, the market breadth has fallen in recent weeks.
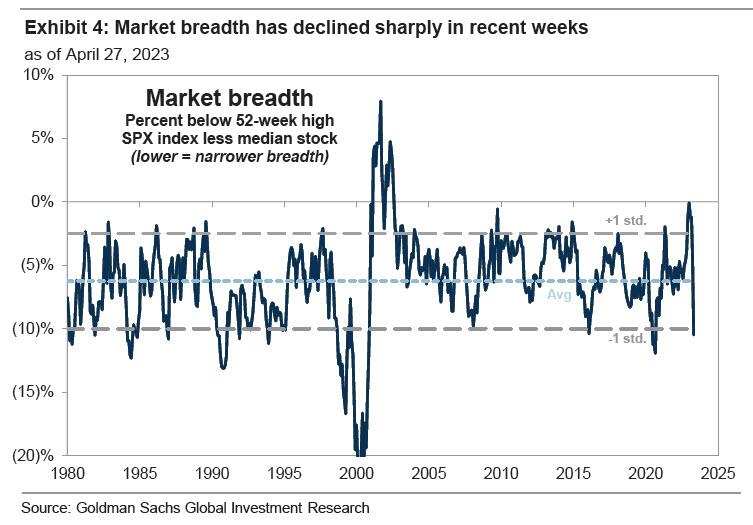
We would expect a broad swath of stocks to participate in a healthy market rally. Hence the term "breadth." Broad participation suggests that investors are confident and optimistic that the rally doesn't overly depend on any small set of stocks.
When the market breadth is low, the rally isn't widespread but instead driven by a small set of stocks. This kind of situation happens when market participants flock to a few high-performing or popular stocks while avoiding the rest.
While such a market can still rally, it's vulnerable to a correction or complete reversal. If a few stocks that were driving up the index start to struggle for whatever reasons, there's a case that it leads to an overall market downturn.
While writing this, I found the right term for what I am trying to describe. "Distorting"
Uhm, I don't have time to write a whole article about market breadth on medium (maybe one day in the future)
Before continuing reading, consider subscribing to the premium newsletter.
Even if you don't trade, the airdrops shared in the newsletters & Discord make up for the subscription cost.
Analyze the markets & communicate with others in the community to make some additional like-minded friends to bond with.

The low price of $24.99 won't stay forever. The current subscription price is a bear market price. However if you decide to subscribe now, these low subscription fee will stay forever and won't change
Anyways you can continue to read further. The article does NOT stop here.
Distorted view
The disproportionate impact that large-cap firms, like Apple, may have on market indexes, can sometimes provide a misleading perception of the state and performance of the market.
Many of the most important stock market measures, like the S&P 500 and the Dow Jones Industrial Average, are based on market cap. This indicates that the success of the index is more significantly influenced by bigger market capitalizations (i.e., the total value of all their current shares) than by smaller ones.
So, if a few large-cap stocks like Apple, Microsoft, or Amazon are doing well, they can drive up the index even if many other, smaller companies in the index are not performing as well.
This can create the impression that the overall market is doing better than it actually is, hence the "distorted view."
Rebalancing can also contribute to this distortion. Index funds and ETFs that track these indices must periodically rebalance their portfolios to match the composition of the index. This often involves buying more shares of the large-cap stocks that dominate the index, which can drive their prices up further and exacerbate the distortion.
Lastly, systematic buying of the index (for example, through index funds or ETFs) can also create a "distorted view" of the market. Because these funds buy all the stocks in an index proportionately to their market cap, they naturally buy more large-cap stocks. This increased demand can push up the prices of these stocks, making the index rise even if the underlying fundamentals of these companies haven't changed.
All these factors can result in a market picture that's heavily skewed by the performance of a few large-cap stocks, potentially masking underlying weaknesses in the broader market.

While such a market can still rise, it could be more vulnerable to a correction or reversal. If the few stocks driving the gains stall for any reason, there's not much of a chance of other advancing stocks picking up the slack, which could lead to an overall market downturn.
Moreover, low market breadth can indicate investors' lack of confidence and conviction. It suggests that they are being selective or cautious in their investments rather than embracing the market rally as a whole.
The lack of broad-based enthusiasm could be a warning sign that the rally is running out of steam, and a market correction may be on the horizon.
MSCI ACWI equal-weight back below pre-Covid Feb’20 high
Let's go briefly over the MSCI ACWI, but I'll try to provide some additional background information, assuming not every reader is years into finance. Let's cover SWP too.
The equal-weighted S&P500 (SPW) and the equal-weighted MSCI ACWI (All Country World Index) are types of stock indices.
The equal-weighted S&P (SPW) is an index that assigns the same weight to each of the 500 companies in the S&P 500, regardless of their market capitalization. That means that each company contributes 0.2% of the index value at each quarterly rebalance.
The equal-weighted MSCI ACWI world index is a similar index that covers large and mid-cap securities from 23 developed & 24 emerging markets countries, with each constituent having an equal weight at each rebalance.
The equal-weighted S&P 500 (SPW) and the equal-weighted MSCI ACWI (All Country World Index) are types of stock market indices. They differ from traditional market cap-weighted indices as they assign an equal weight to each company in the index, regardless of the company's size or market capitalization.
In a market cap-weighted index like the standard S&P 500 or the MSCI ACWI, larger companies (those with a higher market cap) have a greater impact on the index's performance. If a few large companies do well, they can drive up the index, even if the majority of smaller companies are performing poorly.
On the other hand, in an equal-weighted index, each company, big or small, has the same impact on the index's performance. This means that if the majority of companies in the index do well, the index will rise, even if a few large companies are doing poorly.
Equal-weighted indices provide a more balanced view of market performance, as they are not skewed towards larger companies. They can offer insight into the performance of smaller companies and different sectors or regions that might be overlooked in market cap-weighted indices.
For example, if smaller companies or those from emerging markets outperform their larger or developed counterparts, this outperformance will be more apparent in equal-weighted indices. But let's say, if larger companies or developed markets are leading the charge, the equal-weighted indices might not perform as well as their market-cap-weighted counterparts.
In summary, while market cap-weighted indices tend to reflect the performance of larger, more established companies, equal-weighted indices offer a more comprehensive view of the broader market by giving equal importance to all companies, regardless of their size.
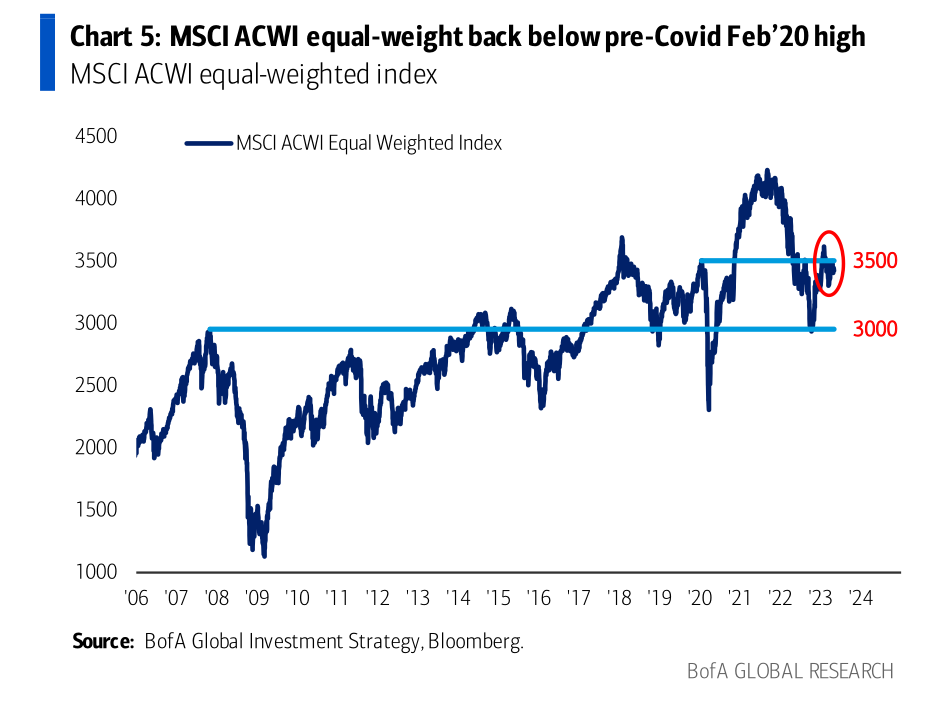
The equal-weighted S&P (SPW) is flat year-to-date, while the equal-weight MSCI ACWI world index is now below pre-COVID Feb’20 highs. This shows the global equity market has been driven by a few large and expensive companies, especially in the US. In contrast, smaller and cheaper companies have struggled to recover from the pandemic.
Chief investment strategist at BofA, warns that if key levels in the NYSE Composite (NYA) at 15k and the Wilshire 5000 at 40k don’t hold
"then proper unwind of risk assets including credit & tech, as investors forced to sell what they love."
Just a quick side note, the NYSE Composite (NYA) is an index that measures the performance of all common stocks listed on the New York Stock Exchange.
Wilshire 5000 is an index that tracks the total market capitalization of all US-based publicly traded companies. These indices are considered to be broad indicators of the US equity market. If they fall below certain thresholds, it may signal a bearish trend and trigger a sell-off of risk assets, such as high-yield bonds and technology stocks, which have been popular among investors in recent years. Tech stocks have been the retail darling.
Flows
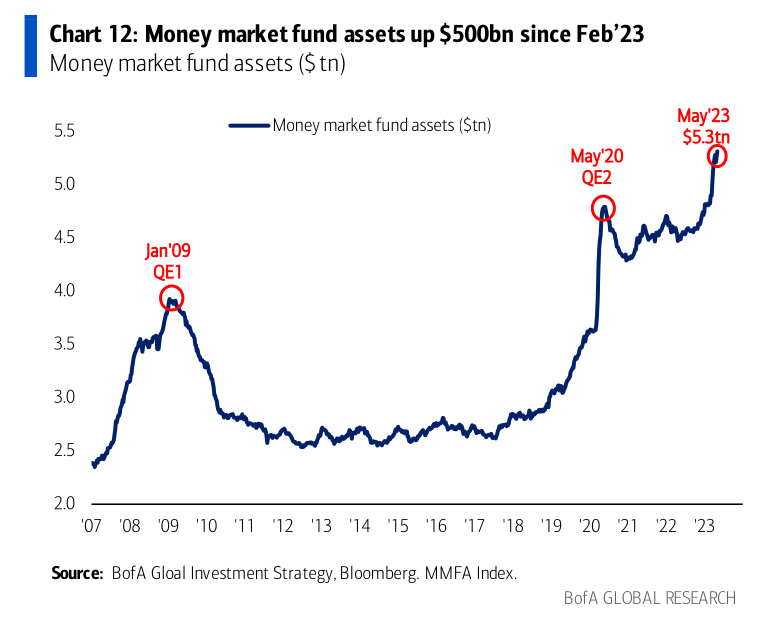
Investors have reportedly allocated a significant amount of $508 billion into cash funds in the first quarter of 2023, marking the highest quarterly inflow since the initial stages of the Covid-19 pandemic three years ago, according to BofA strategists.
The recent collapse of Silicon Valley Bank and other smaller lenders, along with UBS AG's unexpected rescue of Credit Suisse Group AG, can be attributed to a string of bank runs. These events have caused concerns about the stability of the banking system, leading investors to prioritize liquid assets and adopt a risk-averse approach.
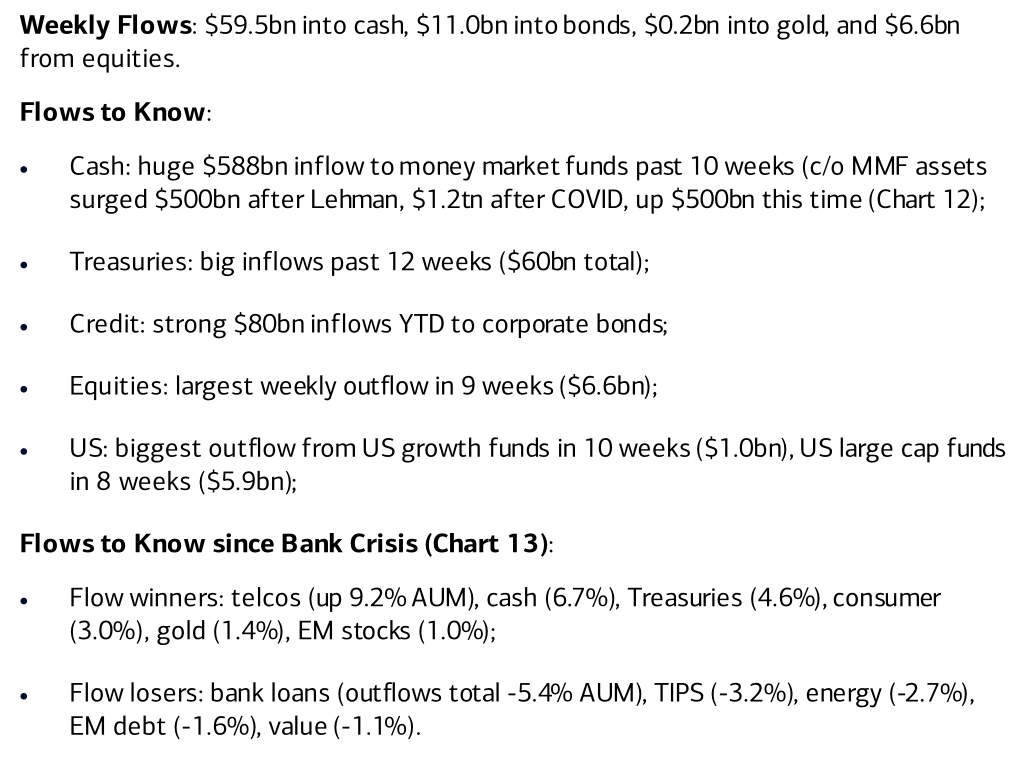
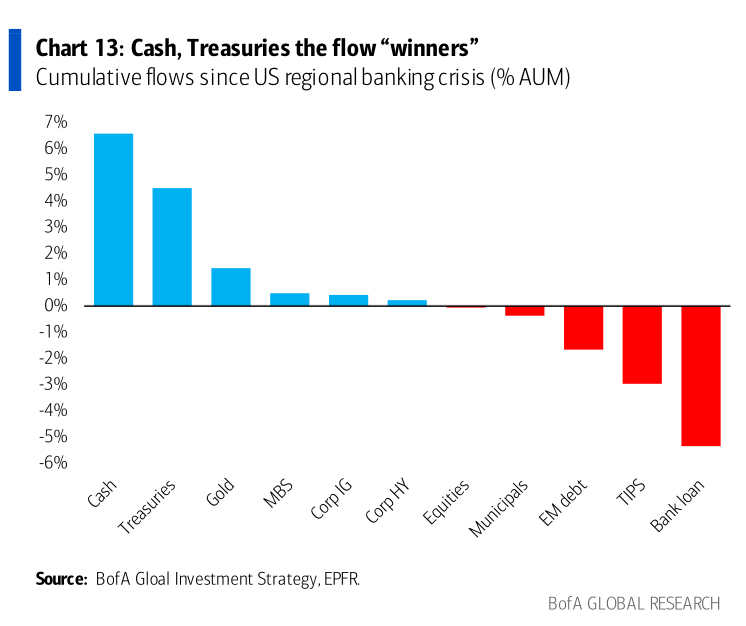
Since the start of the bank crisis, cash flow winners have included telcos (gaining 9.2% AUM), cash (6.7%), Treasuries (4.6%), consumer (3.0%), gold (1.4%), and EM stocks (1.0%). At the same time, notable cash flow losers have been bank loans (-5.4% AUM), TIPS (-3.2%), energy (-2.7%), EM debt (-1.6%), and value (-1.1%).
In just the last 10 weeks, money market funds have experienced a significant influx of $588 billion, while Treasuries have seen a strong inflow of $60 billion and corporate bonds have experienced a substantial $80 billion inflow year-to-date.
On the other hand, equities have seen their largest weekly outflow in 9 weeks with a total of $6.6 billion, and US growth funds have experienced their biggest outflow in 10 weeks with $1.0 billion. US large-cap funds have also seen an outflow of $5.9 billion during this same time period.
If you're enjoying this newsletter, consider signing up for a premium subscription for premium newsletters which also include Discord access
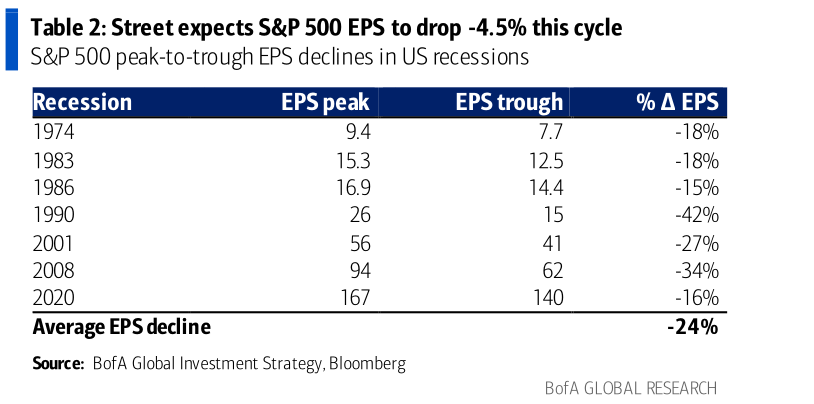
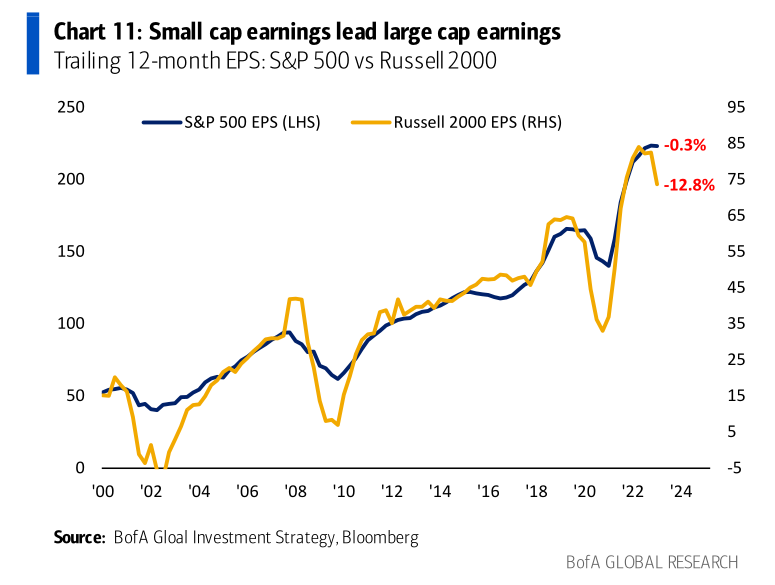
Earnings per share
In 2023, there was a recession caused by strict measures in response to COVID-19. This led to less government spending and less money available, which decreased demand for goods and services and slowed down the economy.
The impact of the recession on various sectors of the economy has been varied. Sectors like credit, technology, and homebuilding have demonstrated resilience and continued to experience positive growth. However, other sectors such as oil, small caps, and banks have been hit hard and experienced negative earnings.
The earnings per share of small-cap companies have decreased by 13% from their highest point, whereas the S&P 500 EPS has maintained its stability.
The following factors could influence the duration and severity of the recession:
- The pace and direction of inflation: If inflation remains high or accelerates, it could force the central bank to raise interest rates further, which would worsen the recession. If inflation moderates or declines, it could allow the central bank to ease monetary policy and stimulate the economy.
- The level and distribution of consumer confidence: If consumers lose confidence in the economy and their income prospects, they could reduce their spending and saving, which would lower aggregate demand and output. If consumers remain confident and optimistic, they could sustain their consumption and support economic growth.
More info about aggregate demand & output:
- The degree and effectiveness of government intervention: If the government implements fiscal stimulus measures, such as tax cuts or infrastructure spending, it could boost aggregate demand & output. If the government fails to act or implements ineffective policies, it could prolong or deepen the recession.
- The state and outlook of global trade: If global trade recovers from the disruptions caused by the pandemic and trade tensions, it could increase exports and income for domestic producers. If global trade remains weak or deteriorates further, it could reduce external demand and output for domestic producers.
Before continuing to read this, ByBit is making KYC mandatory.
Consider ApeX DEX
Instructions:
https://twitter.com/RNR_0/status/1652360705331347461
Signup: https://pro.apex.exchange/trade/BTC-USDC/register?affiliate_id=46&group_id=83
Ref code: 46
Still prefer Bybit? Sign up to Bybit with my link for a deposit bonus up to $30k: https://partner.bybit.com/b/PA0ON66G6776
Big tech
Apple, Microsoft, Google, Amazon, Tesla, Meta, and Nvidia are being valued by the market at a significantly higher price-to-earnings (P/E) ratio than the average for the rest of the companies in the S&P 500 index
The P/E ratio is a valuation metric that measures the current share price of a company against its earnings per share.
A higher P/E ratio suggests that investors are willing to pay a higher price for each dollar of earnings, usually because they expect the company to grow its earnings at a higher-than-average rate in the future.
AAPL, MSFT, GOOG, AMZN, TSLA, META, and NVIDIA are currently trading at an average price-to-earnings (P/E) ratio of 30x for the current year, investors are expecting higher-than-average earnings growth from these companies compared to the current S&P500 average P/E of 16x.
However, it seems like market participants did not yet take into account the potential effect of a potential recession, something which could affect the tech sector disproportionately.
It is noteworthy that the Big Tech sector has an average P/E ratio of 30, which is significantly higher than the average P/E ratio of 16 for the remaining companies in the S&P 500.
Investors expect much higher earnings growth from these tech giants compared to the average company in the S&P 500.
These investors might not be taking into account the potential impact of a recession.
During economic downturns, tech stocks may be more vulnerable due to their high valuations relying on projected future earnings growth, which can be challenging to attain in a recession.
Based on recent labor market data, there are indications that a recession could be approaching. The decline in job openings, especially among small businesses, along with the rise in unemployment claims, may be early indicators of an economic downturn.
Investors seem to have already factored in the possibility of a recession when it comes to small-cap stocks. This is reflected in their lower P/E ratios, as investors anticipate a slowdown in earnings growth.
But the tech companies' high P/E ratios suggest that investors have not yet priced in this risk for these companies.
The Senior Loan Officer Survey could provide further insights into the state of the economy. If this survey shows signs of a tightening credit market, it could be another indication of an impending recession.
If that's the case, the 7 big tech stocks might be overvalued, as their current high P/E ratios do not reflect the potential impact of a recession on their future earnings growth.
Trades to take
Trades to take if this was the last rate hike. These are short-term trades to take for a couple of months.
The rest of the article is for premium members. Subscribe for a premium membership... https://romanornr.io/#/portal/ 🖋