Market insight June 21, 2022
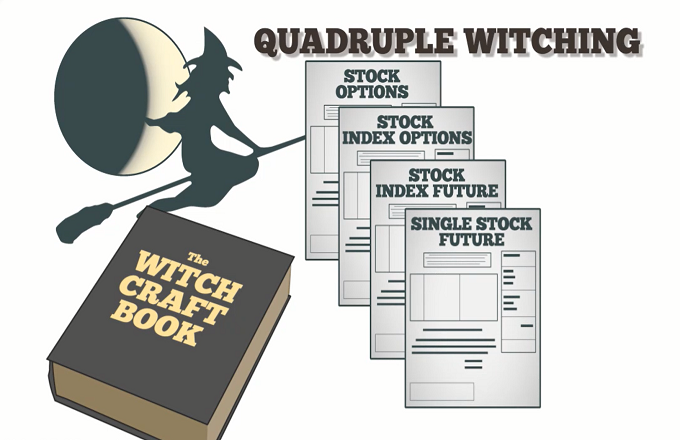
On Friday, June 17, the quadruple watching hour ended. There was some risk on a "fat left fail," which I mentioned, but I had a bias that there would be a squeeze on Monday/Tuesday.
the fat left tail?
In this context, a fat left tail means a higher-than-usual chance that the market will go down. That is because the customer/trader usually has a long position in the market through the underlying market and a short position in the market through the put option.
So, if the market starts going down, the traders will likely buy more put options to protect their position. That can cause the market to move lower than expected, which is why the market is more likely to move lower than usual.
Quick recap, on June 13
On June 13, the SPX500 produced a near 3-sigma event as dealers were forced to chase their deltas, exacerbating the market's negative pressures.
You may wonder, what is a 3-Sigma Event?
Standard deviation is a measure of how spread out a set of data is. A 3-sigma event is an event that is three standard deviations from the mean. An event that is three standard deviations from the mean is very rare, happening only 0.27% of the time.
In other words, a 3-sigma event is an event that is very unlikely to happen.
So what happened yesterday?
On June 13, there was a 3-sigma event in the stock market.
That means the market fell more than three standard deviations from the mean. That is an unlikely event, happening only 0.27% of the time.
As a result of this event, dealers were forced to chase their deltas.
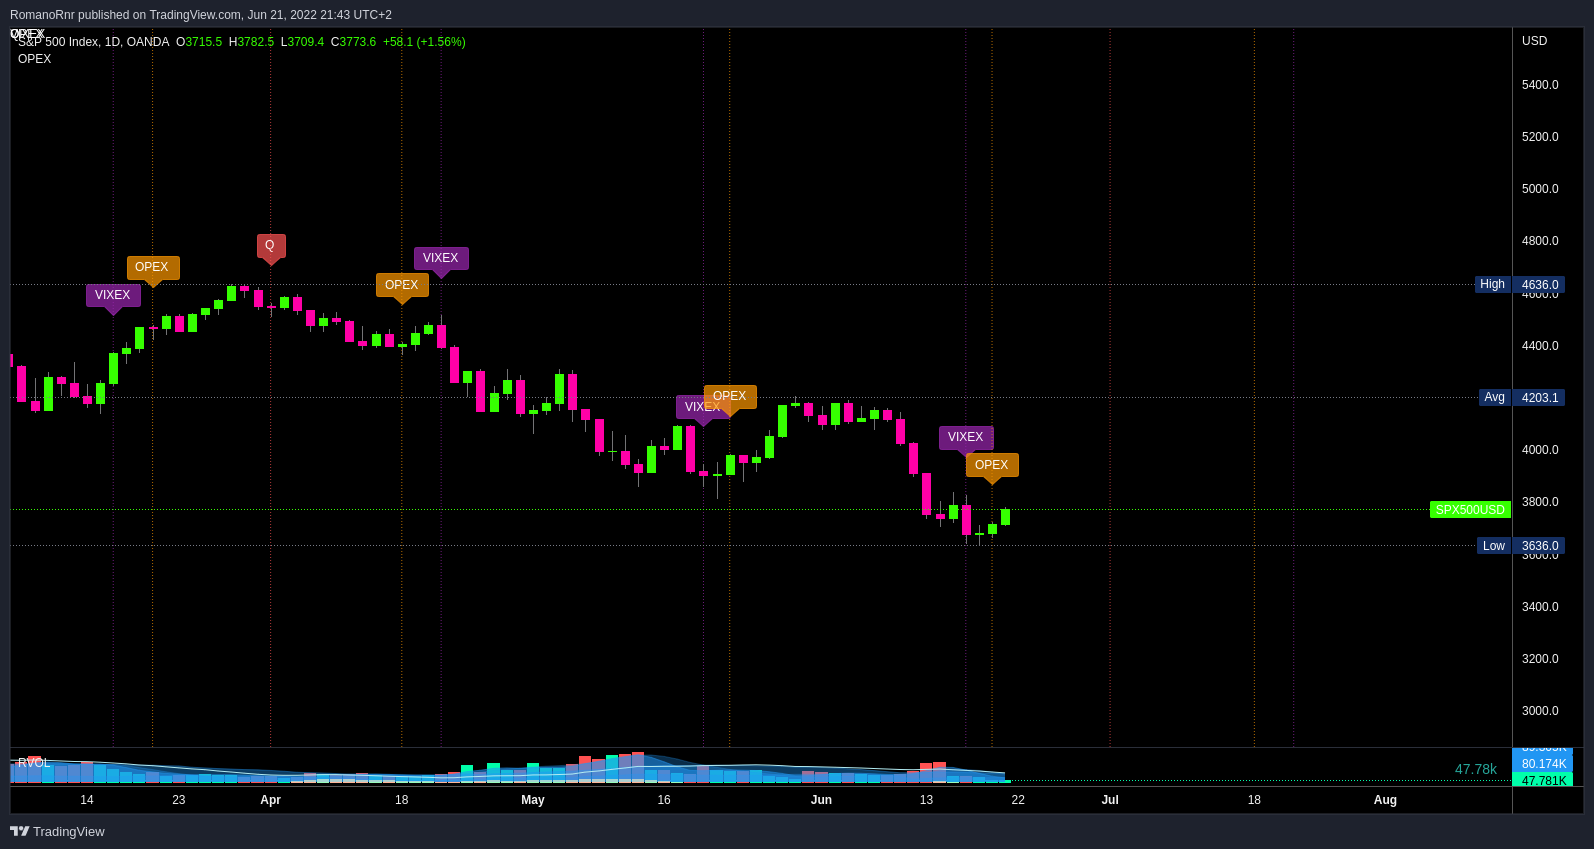
However, after such ready for a rebound here, this chart is one to keep an eye on until July, as they believe the market will eventually trade down following the quarterly options expiry in June (OPEX).
SPX500
The option quad expiry (OPEX, also known as Option Expiration) lowered the dealer's negative gamma position in S&P500 by about $900,000,000 in notional value.
That demonstrates that the value of the heavily put option contracts decreased as the price of the underlying asset (the S&P 500) climbed. That should reduce intraday volatility since investors will no longer have to sell when the price rises.
As mentioned in my previous article, just a little further explanation for the new readers,
When market participants keep buying "put options" (positive gamma, negative delta), the dealer, on the other will be stuck with the opposite trade, which is "short-put" and therefore has a positive delta and negative gamma.
Suppose prices fall more than expected. That forces dealers to hedge their bets and sell the underlying or and futures to get back to delta-neutral, making the market fall even further. We saw large investors selling their positions while individual investors were not active.
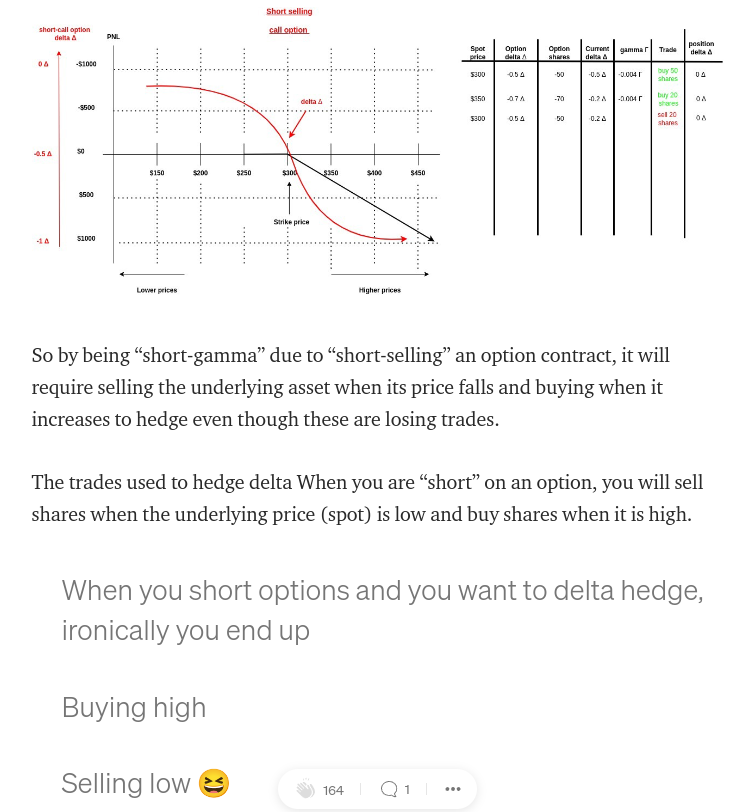
As mentioned in my options article about gamma & delta hedging
https://romanornr.medium.com/options-trading-part-3-gamma-curvature-risk-9f6dd4b3db5b
Screenshot of the article
Now I get the question a lot:
What is Negative Gamma?
Negative gamma is a measure of convexity. It is the second derivative of the price of an option with respect to the underlying asset/market price. In other words, it measures how the price of the option contract changes as the underlying market price changes.
An option contract with negative gamma ("short-puts, short-calls" and whatever strategy gives a negative gamma exposure.... like FTX MOVE contracts short. Which is basically a short straddle.
Anyways continuing on
While the S&500 experienced some intraday volatility, it closed modestly higher. There was a lot of volatility during the day, but prices ultimately ended up only slightly higher than where they began.
So as mentioned, there was a risk of fat left tail, but I had a slight bias for a move up for a relief rally.
The S&P500 did not disappoint and delivered a small relief rally I anticipated.
Continue on
With the expiration of options contracts (OPEX) in June, markets will begin searching for new levels. We can expect a post-OPEX rally to begin for the S&P500 and resistance around the $3800 level. However, there is less overall resistance until the 4000 area as options positions have been reduced. That could mean a short-cover rally.
What is a short-cover rally?
A short-cover rally is a price increase in a market induced by a large number of traders covering their short positions. This buying pressure might push up prices.
On the downside, there is nothing significant at the $3700 strike price as the "put option wall" shifts to the $3600 area.
There is also support at the 3620 level from the short leg of the 6/30 JPMorgan (JPM) spread.
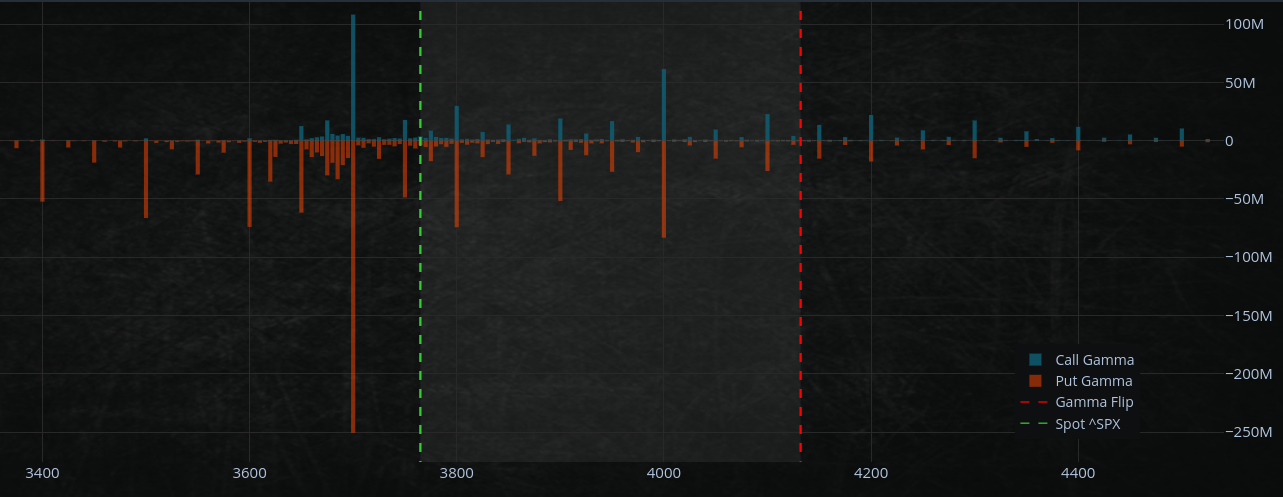
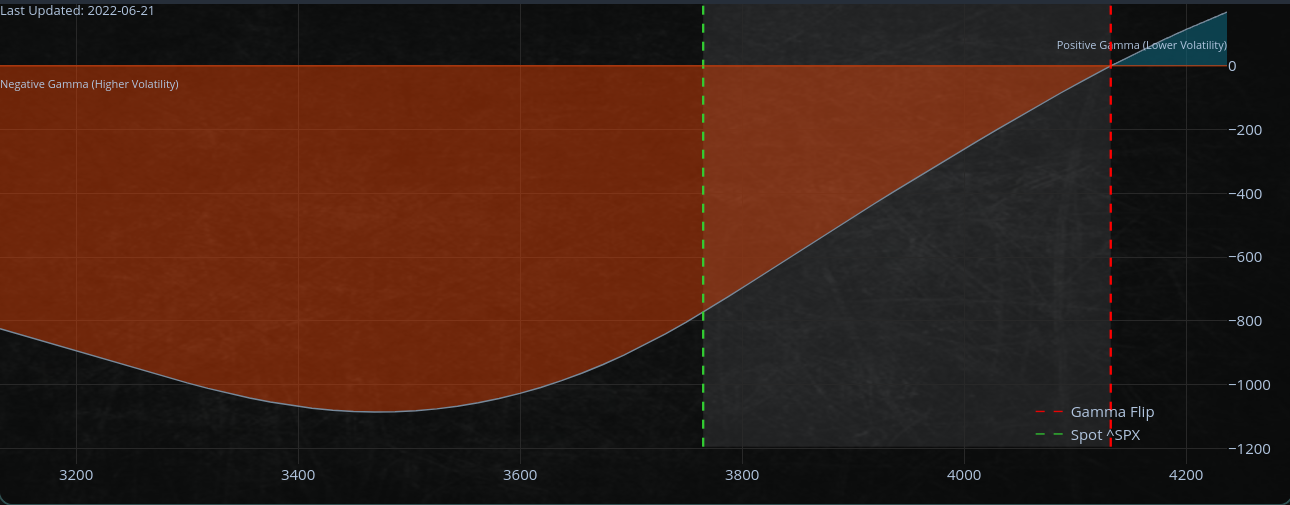
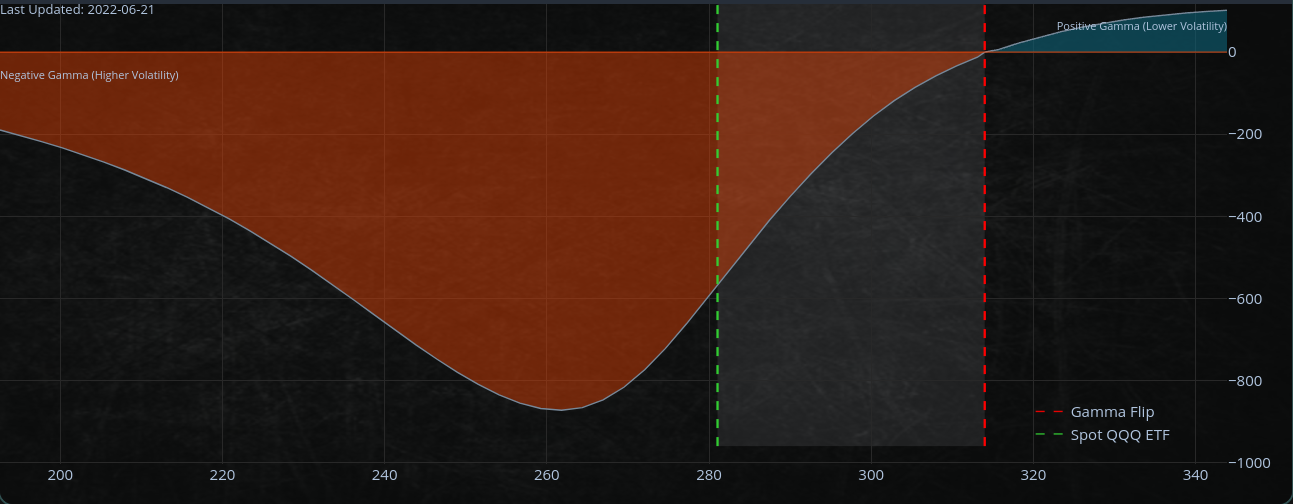
S&P500 Gamma curve
The gamma curves depict the rate of change in the delta of an option.
The delta quantifies the sensitivity of an option's price to changes in the underlying asset. Options traders use the gamma curve to estimate how the delta will fluctuate in response to changes in the underlying asset price.
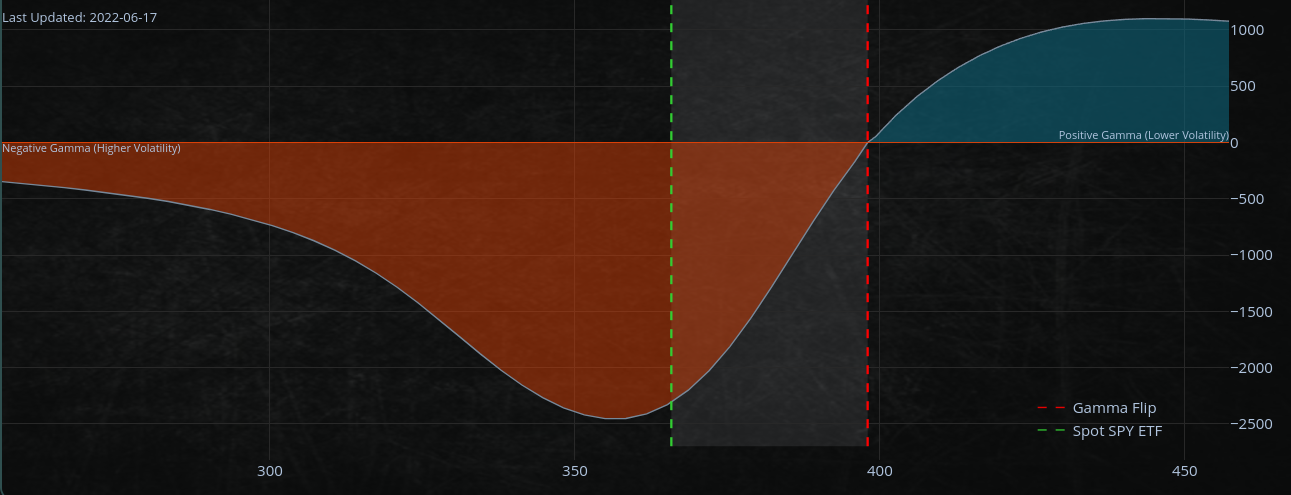
Updated Gamma curve:
The new gamma curves indicate that puts have been rolled "down and out," shifting the market's lower limit to lower strike prices. That implies that with each option's expiry, there is a systematic rollover of put hedges to lower strike prices, creating an "opening" for the S&P500 to trade lower probably in July.
What is systematic rolling:
Systematic rolling is the process of rolling over options contracts on a regular basis. This is typically done in order to avoid the expiration of the contract. When an options contract expires, the trader no longer has the right to buy or sell the underlying asset. By rolling over the contract, the trader can extend the life of the contract and continue to trade the underlying asset.
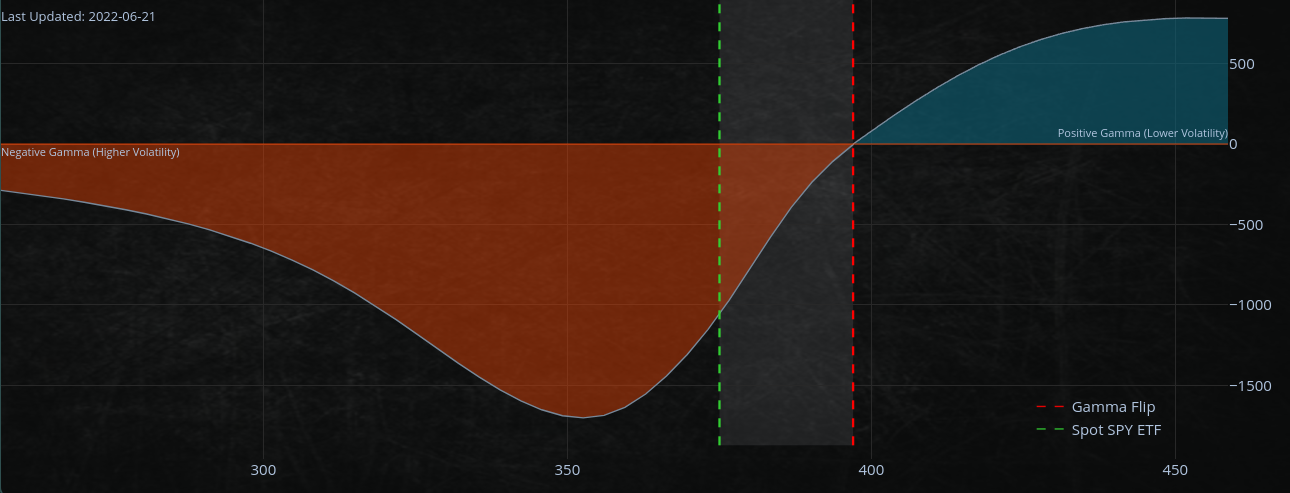
Updated Gamma chart for the S&P500
Crypto weekend
Now crypto is really something. The markets in crypto are open 24/7, every day, every hour.
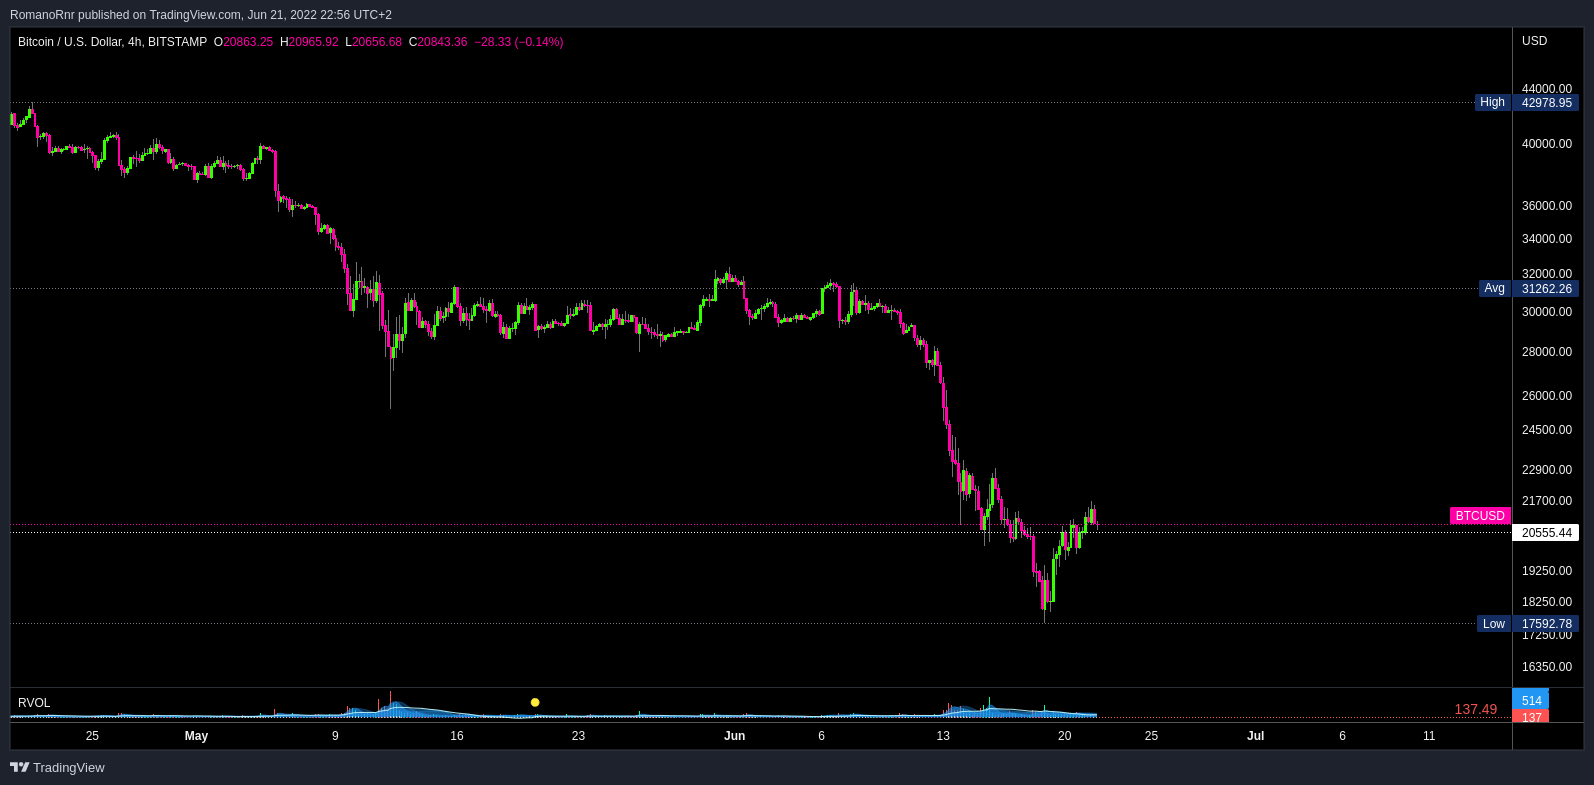
The cryptocurrency markets saw substantial volatility during the holiday weekend, with Bitcoin falling below the previous cycle high of $20k due to forced liquidations totaling tens of billions of dollars.
Cryptocurrency markets experienced some degree of capitulation last week, and it is fair to anticipate a more optimistic tone this week as a short squeeze might be unavoidable.
However, there is no imminent source of buying from systematic rebalancing methods in the coming days, and the gamma remains negative.
Bitcoin's price declines have attracted skeptics who are quick to claim that the cryptocurrency is doomed. However, bitcoin has shown remarkable resilience in the face of such negativity, suggesting that it may still have a bright future ahead.
Source: BofA Global Research
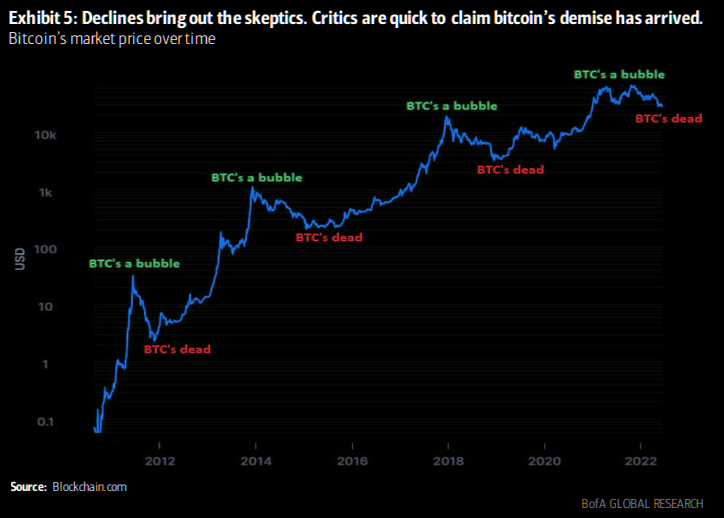
Can we say the bottom is truly in for bitcoin? I doubt that, but I think bitcoin will have a violent bounce/short squeeze to the upside in the upcoming days.
Ethereum crashed too due to panic, 3AC becoming insolvent, and Celcius possible liquidation and other massive liquidations.
However, they say, "All gaps must be filled", well we filled the gap on Ethereum.
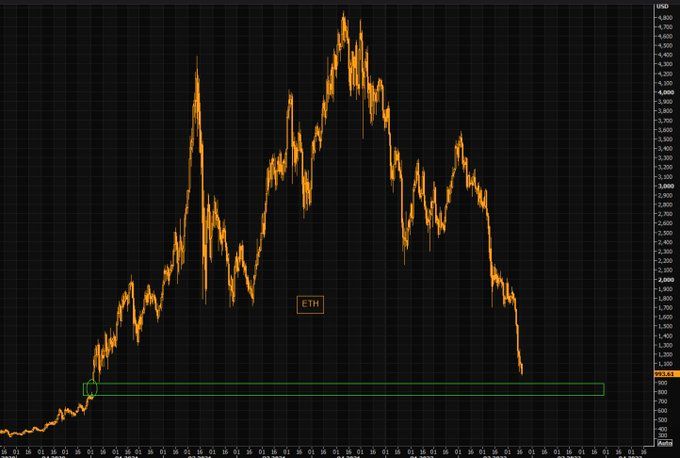
There's some room for a violent short-squeeze for bitcoin. The temporary bottom is $17k, which might doesn't hold forever, but enough time for a decent squeeze as traders close their short of free will or by force.
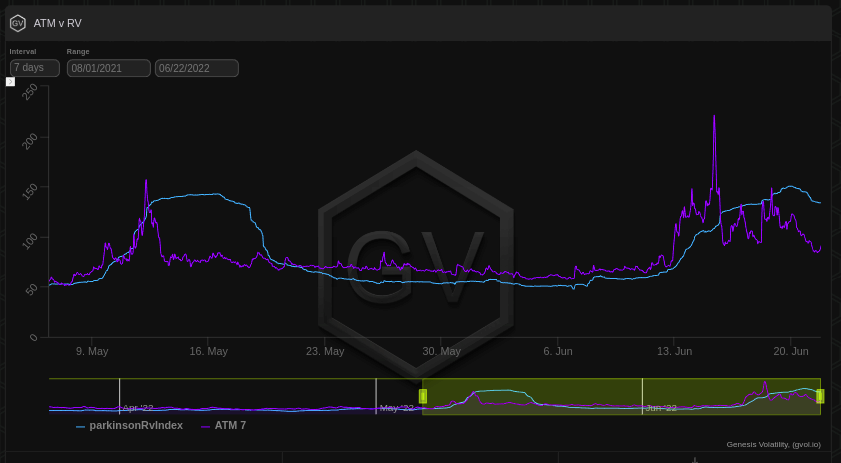
Crypto vol
Since the large panic sell-off that happened a few weeks ago, the cryptocurrency market has significantly calmed down. That is obvious by the dramatic decline in Bitcoin volatility levels.
Realized volatility is a measure of how much the price of an asset really fluctuates, while implied volatility is a measure of how much investors anticipate it to change in the future. As shown in the first graph, Bitcoin's implied volatility has reached its lowest levels while its realized volatility has also reached new post-panic lows.
Overall, the decrease in volatility levels suggests that the crypto market has returned to a more normal state after the panic sell-off that occurred a few weeks ago. This is good news for retail traders for you and me (for now), as it indicates that the market is no longer in a state of panic and is instead behaving more rationally. (I'm using "rationally" very loose here...)
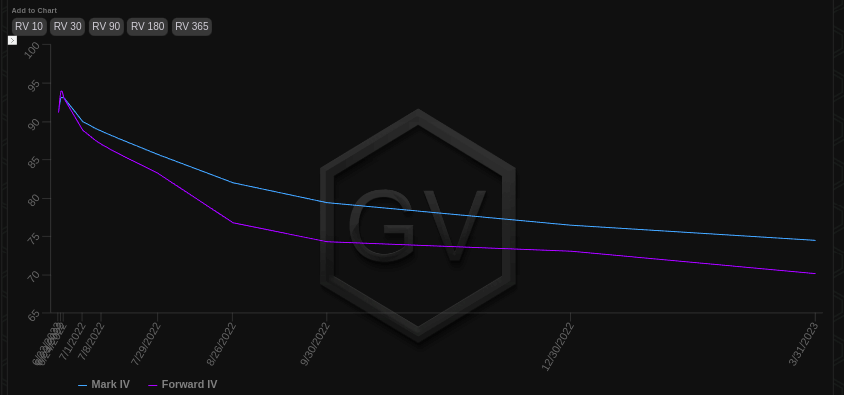
The term structure of bitcoin is the relationship between bitcoin prices at different times.
The term structure for bitcoin showed an upward slope until June 24. After June 24, the term structural changes to backwardation. That change in the term structure may be due to market expectations of a future decrease in the price of bitcoin or volatility.
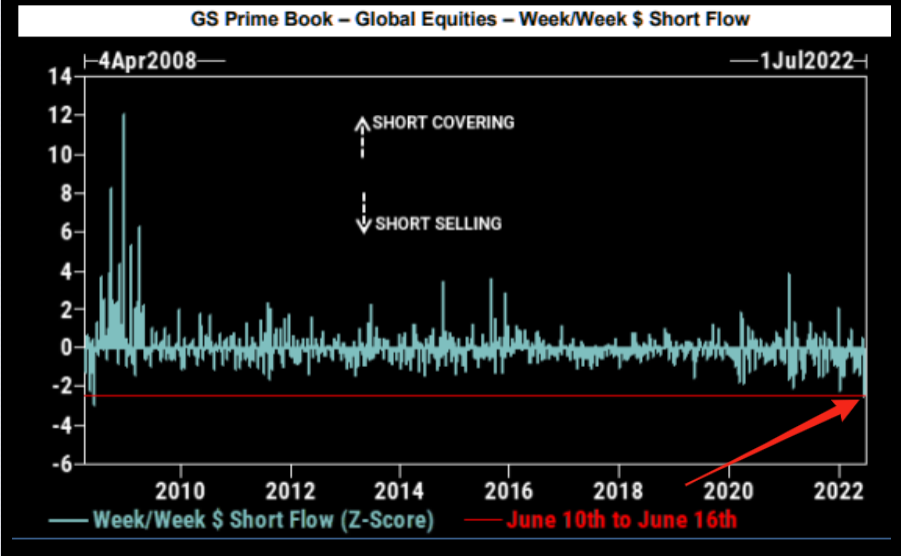
Nasdaq
The level of shorting activity we have seen lately is unprecedented. The bearish sentiment is stronger than the underlying fundamentals. That is particularly evident in the NASDAQ.
Nasdaq chart
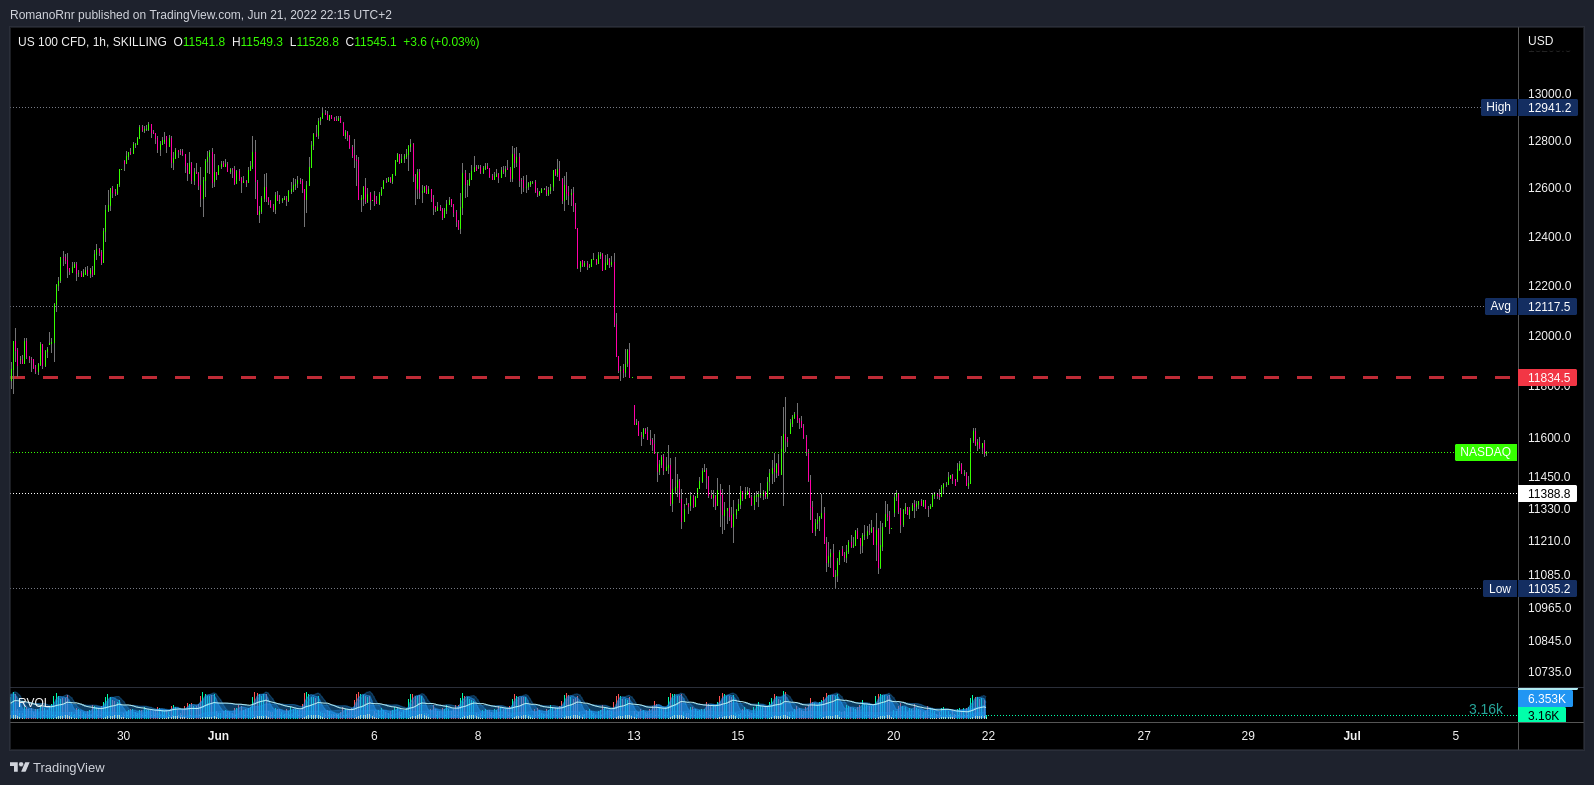
We could see a violent squeeze in the Nasdaq. Why may you wonder?
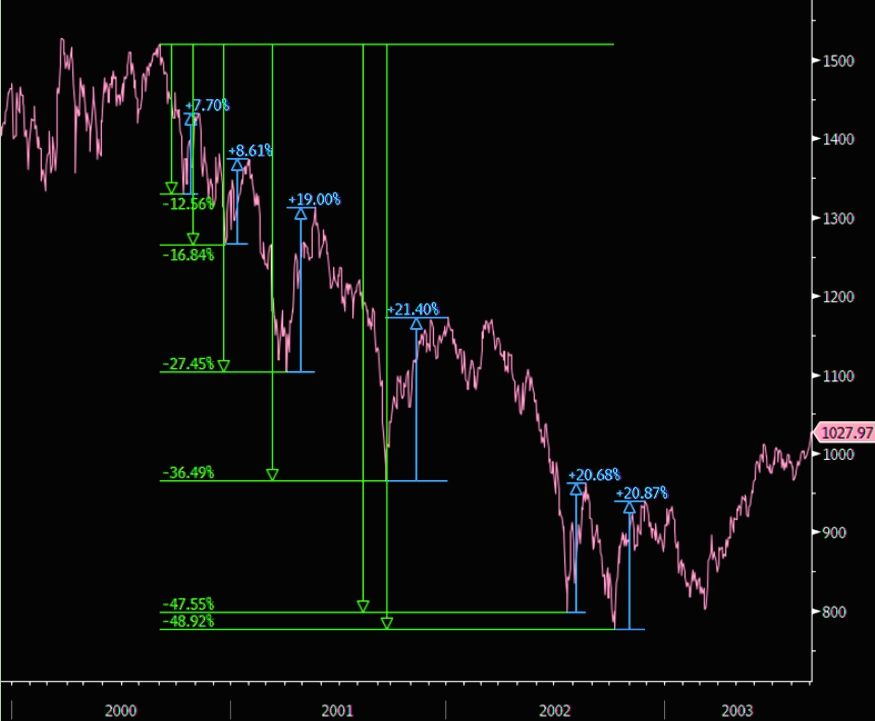
Bear market rallies tend to get bigger the more prolonged the bear market continues so that we could see a significant rally at some point. However, it's important to remember that we are still in a bear market, and the magnitude of the fourth squeeze in bear markets between 2002 and 2008 was 21% and 19%, respectively.
Well, my dear reader, let's observe these historical charts below
2000 - 2003
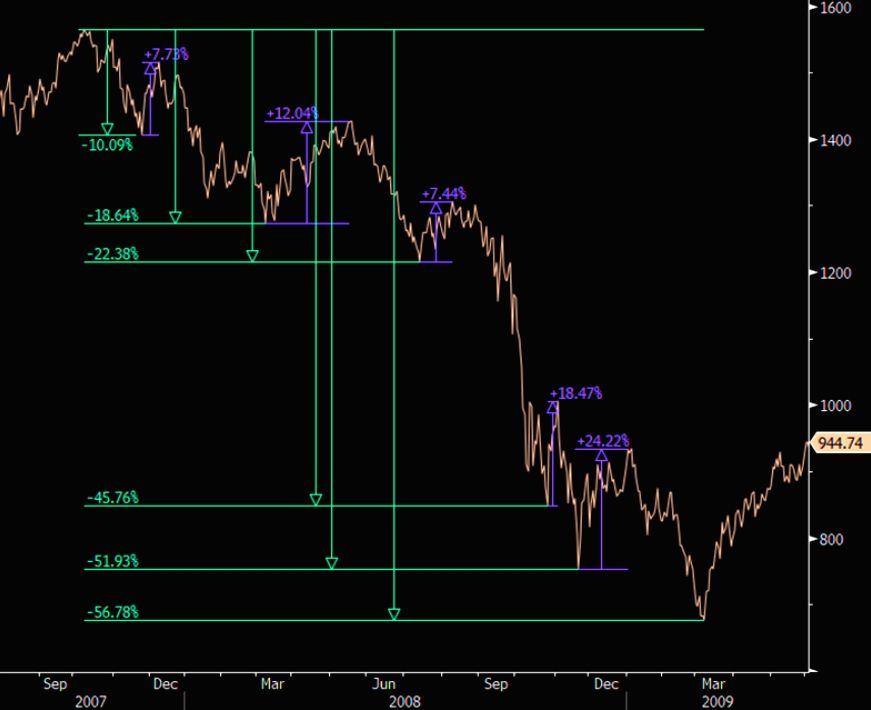
2007 - 2009

Falling prices and pessimism characterize bear markets among investors. Nevertheless, even in a bear market, there will be periods of rising prices, known as bear market rallies.
Bear market rallies tend to become more remarkable as the bear market gets deeper and older. That is because as a bear market unfolds, investors grow more eager for any evidence of a recovery and are prepared to pay ever-increasing prices for assets they hope will return.
Eventually, the bear market will end, and prices will begin to climb continuously once again.
We don't know if the bottom is truly in. From a macro view, markets may fall again in July. Until this occurs, however, we should be mindful that bear market rallies may be strong and should not buy blindly merely because prices are increasing in the near term. The real bottom might not be in.
Why?
The roadmap: Nasdaq 2002 vs. 2022
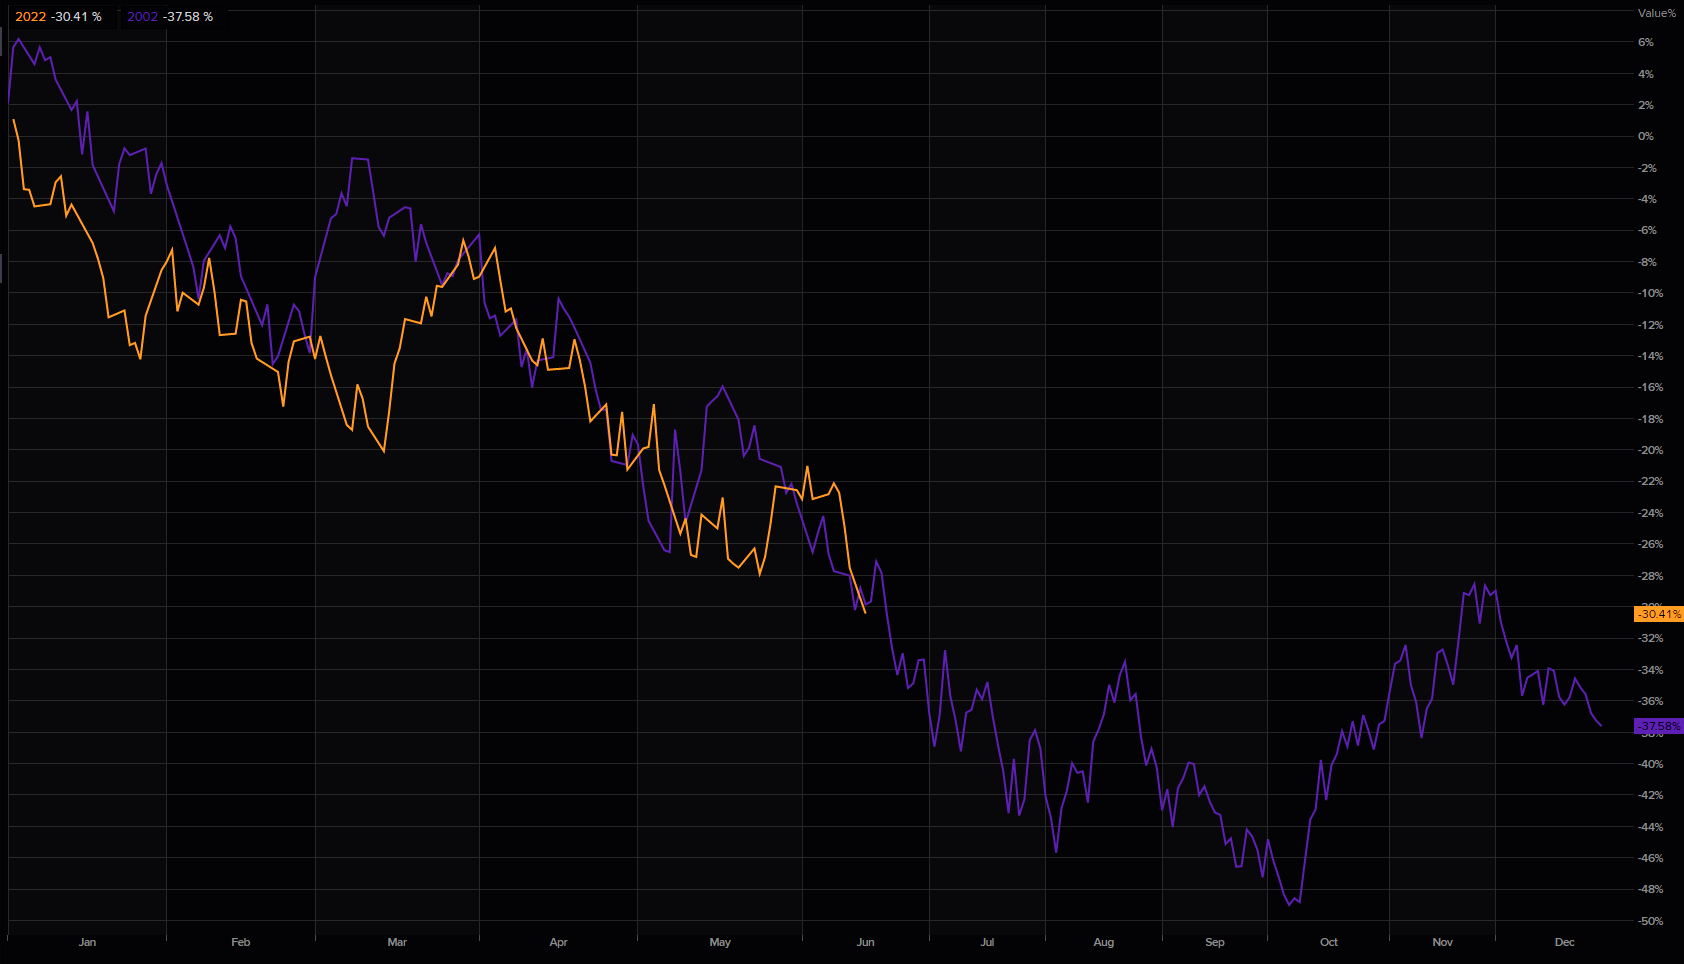
The current market situation resembles the past. In 2002, the market had fading rallies and remained falling. Many struggled as they tried to catch a falling knife. The graph compares 2002-2022 NDX.
However take it with a grain of salt, it doesn't have to play out, but it's likely. So far, it's been following its course to "Goblin-town".
QQQ
Current market circumstances are marked by high frustration levels, inadequate liquidity, and an abundance of short gamma.
These factors have led to the market's quick and irregular fluctuations. To counter the deltas of their holdings, dealers have been chasing the market down, but this has just exacerbated the issue.
On the way up, dealers need to chase deltas from short gamma positions while buying back deltas. That has caused a lot of pain for those with short gamma positions
J.P. Morgan notes
that there are signs of relief. On Friday, $3.5T of gamma will expire, and 40% of the Street will close short gamma positions at the open. While we still have a significant amount of short gamma, the absolute amounts have become less aggressive. Unfortunately, the lack of liquidity persists.
Short-gamma rolling off?
That relates to closing off short gamma holdings. When gamma is negative, the position is sensitive to fluctuations in the underlying asset price. A short gamma position will increase in value when the asset price declines and decrease in value as the asset price increases. To settle a short gamma position, the trader must purchase the same amount of contracts that were sold short. Typically, this would be done at a lower price to cover losses from the short position.